What's Wrong With One-Factor-at-a-Time?
Abstract
One-Factor-At-A-Time is the most common experimental methodology, but it suffers from serious weaknesses: it is subjective, it isn't thorough, and it ignores factor interactions. Using a model corrects these weaknesses. A combination of Design of Experiments and Response Surface Methodology can be used to make a model.
Introduction
Nature is complicated. It's not easy to run experiments that include all of Nature's rich variety. Experiments typically must be simplified to keep track of what's happening and this can cause us to misunderstand reality.
Early scientists used One-Factor- At-A-Time experimentation to balance simplification with understanding. This is still the most common experimental methodology. Unfortunately, it has major weaknesses.
Thanks to computers, we can now run experiments that are closer to reality and not subject to the errors inherent in One-Factor-At-A-Time experimentation.
A Few Important Definitions
Let's make sure we are using the same definitions of a few key terms to avoid misunderstandings.
Response: an attribute of Nature which you have set goals for, but over which you have no direct control. Some examples are: excellent color for digital photos, superior taste for a cinnamon roll, or great sound from an mp3 player.
Factor: an attribute of Nature over which you have direct control. Some examples are: red, green and blue slider settings in a photo editing software; “cinnamon,” “cardamom” and “vanilla” as spices in a cinnamon roll recipe; or “type of amplifier circuit,” “transistor gain,” and “output impedance”for an mp3 player.
Level: An amount of an attribute of Nature. Some examples are: “256” as a slider setting in a photo editing software; “1 tsp cinnamon” in a cinnamon roll recipe; or “Class A amplifier circuit” for an mp3 player.
Factor Interaction: when the effect a factor has is dependent on the level of another factor. A classic example is baking a cake–the effect of temperature is dependent on the baking time.
A research engineer's job is to choose factors that are believed to influence important responses when the levels of the factors are changed. A development engineer must then optimize the levels of the factors to meet the goals on the responses.
What is “One-Factor-At-A-Time?”
Engineers and scientists accomplish their work by experimenting. The most popular experimental methodology is called One-Factor-At-A-Time. When using One-Factor-At-A-Time, an experimenter holds all experimental factors constant except one. This one factor is varied to discover its best level. Then this factor is held constant, and another factor is chosen to vary. This is repeated until the best level for all factors has been found. If all goes well, this will be your Sweet Spot – the combination of factor levels that meets your response goals.
Unfortunately, it is very common to reach this point and not have found the Sweet Spot. (We will discuss why this is shortly.) Frequently the experimenter must start the process again beginning with the best combination found so far. This “starting over” often must also be repeated in an iterative process until a real Sweet Spot is found.
Weaknesses of One-Factor-At-A-Time
Why doesn't One-Factor-At-A- Time find the Sweet Spot the first time? Because One-Factor-At-A-Time has major weaknesses:
- One-Factor-At-A-Time does not thoroughly examine all of the possible factor combinations.
- One-Factor-At-A-Time prevents you from studying factor interactions.
- One-Factor-At-A-Time is subjective.
Let's take a look at why One- Factor-At-A-Time doesn't thoroughly cover the possible factor combinations. To do this, it helps to have a way to “see” what is happening in an experiment. A box, or cube, provides a nice picture for what can happen in an experiment. If you have three factors to study, each dimension of the box can represent the possible levels for one of the factors as shown in Figure 1. Each corner is a combination of high and low levels. Each point in the cube and on the surface of the cube represents an experimental trial.
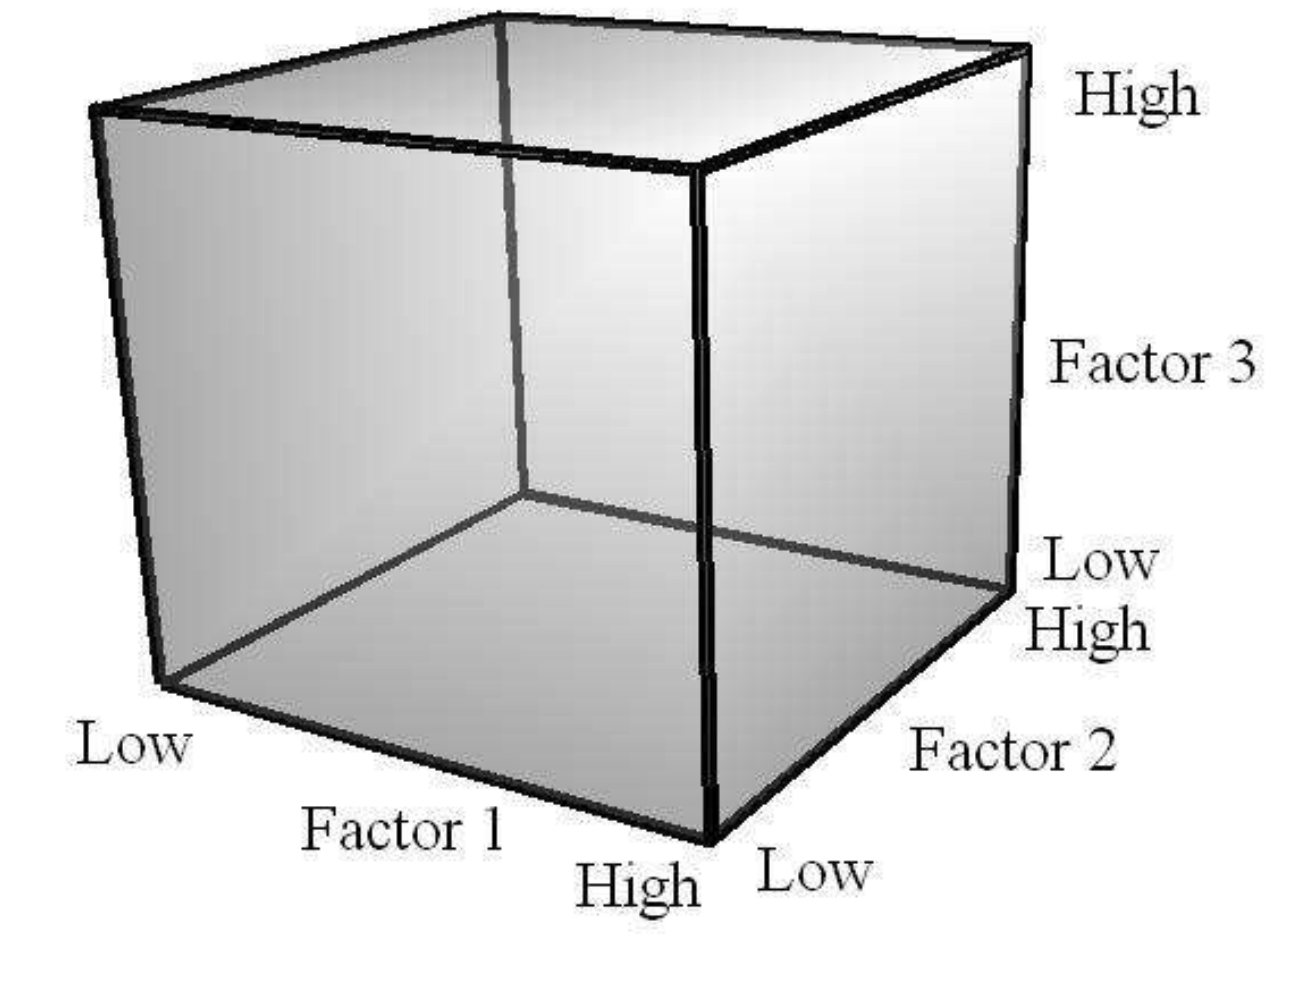 Figure 1. "Seeing" an Experiment
Now suppose we want to “see” what a One-Factor-At-A-Time experiment looks like. We can draw arrows on the cube representing each trial as in Figure 2. The numbers at each corner represent a hypothetical experimental response, higher numbers being better. Looking at Figure 2 you can see that many portions of the cube are left unexplored. These regions might harbor a Sweet Spot which would be missed. You need luck to find the Sweet Spot!
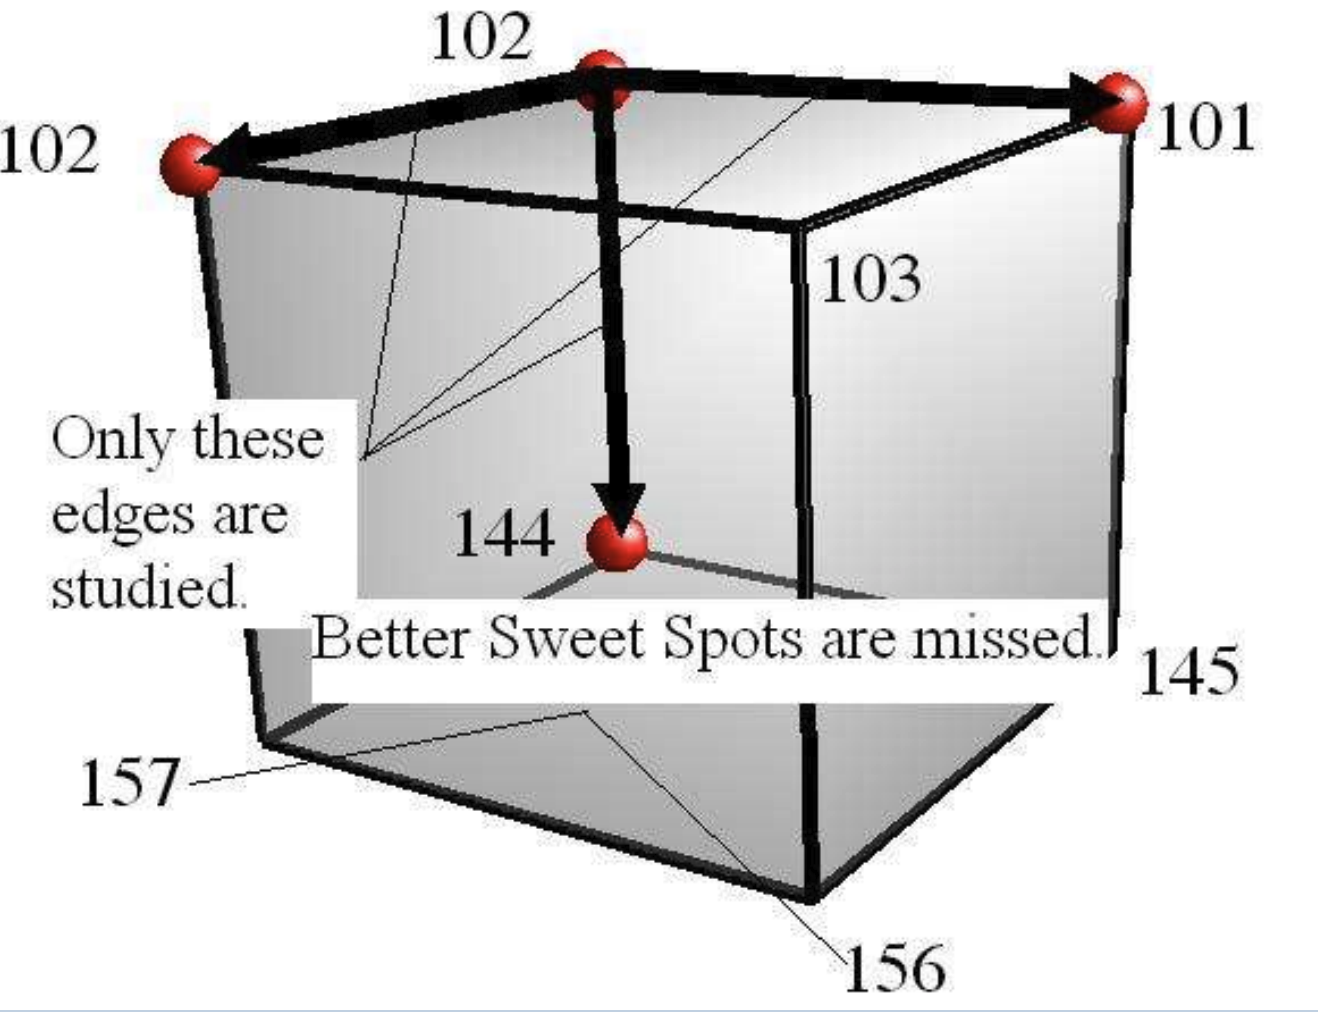 Figure 2. One-Factor-At-A-Time
Even if a Sweet Spot is found, a better Sweet Spot, i.e. a better product, could be lurking in the unexplored region.
In Figure 2, only three edges are actually studied. The rest of the cube is left unexamined. How did this come about?
The first trial was at the corner representing low factor 1, high factor 2, and high factor 3. The quality at this corner was 102. The next trial held factors 2 and 3 constant, and varied factor 1 to its high level. The quality here was 101, a decrease, so the conclusion is that factor 1 should be set low. Next factors 1 and 3 were held constant, and factor 2 was varied from high to low. It appears that factor 2 has no influence, so it was left high. Last, factors 1 and 2 were held constant while factor 3 was varied from high to low. Quality jumped to 144, leading to the conclusion that the Sweet Spot is at factor 1 low, factor 2 high (or it doesn't matter) and factor 3 low. As you can see, most of the cube remains unexamined, including two corners with significantly higher responses.
To see the second problem with One-Factor-At-A-Time, take a look at Figure 2 again. This time notice that when factor 3 is high (the top of the cube), the response changes little as factor 2 is varied from low to high– factor 2 has little effect when factor 3 is high. Notice also that when factor 3 is low, the response changes a lot as factor 2 is varied from low to high– factor 2 has an important effect when factor 3 is low. This is an interaction between factors 2 and 3.
Interactions are found in two ways:
- accidentally, or
- by varying factors together to see the effect.
One-Factor-At-A-Time, by its very nature, varies only one factor at a time. The only way to find an interaction with One-Factor-At-A-Time is accidentally – by luck!
Finally, One-Factor-At-A-Time is subjective. Where do you start?–All factor levels high?–Or low? Which factor do you vary first? These choices are subjective and they can have a profound effect on the outcome of your experiment.
Improving One-Factor-At-A-Time
The weaknesses of One-Factor-At- A-Time are eliminated by using a Designed Experiment and a model: a surface used to help visualize something that is difficult to observe or cannot be directly observed. A model also lets you take advantage of the fact that Nature generally changes responses smoothly as factor levels change. You can see an example of a model in Figure 3.
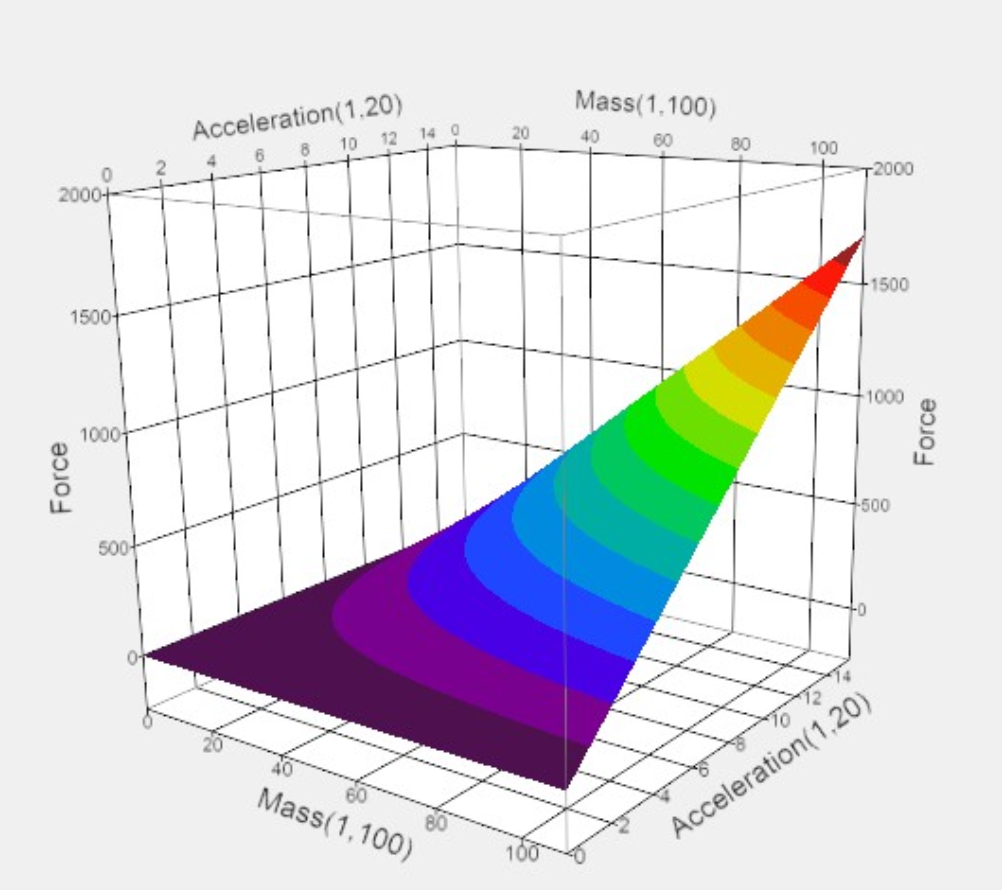 Figure 3. A Model of Newton's Second Law of Motion
Notice that the model in Figure 3 shows the force obtained by accelerating a mass. By choosing a level on the “Mass” axis and a level on the “Acceleration” axis you can find the predicted force on the “Force” axis. Notice that the interaction of mass and acceleration looks like a twisted plane– the effect of “Acceleration” on “Force” is dependent on “Mass.” In other words, mass and acceleration interact. When the mass is large, acceleration has a big effect on force. When the mass is small, acceleration has very little effect on force. A model lets you make predictions for any factor combination of interest and it specifically includes factor interactions, correcting two of the major weaknesses of One-Factor-At-A-Time. A Designed Experiment objectively chooses the trials to run, eliminating the subjectivity.
Making A Model
You can make a model of your experimental results using a combination of Design of Experiments (DOE) and Response Surface Methodology (RSM). Design of Experiments provides an experiment design–a list of experimental trials that will provide the best data for building a model. Response Surface Methodology is the technique used to make a model using your data from your designed experiment. You can see an example of a design in Table 1 and an example of a Response Surface model in Figure 4.
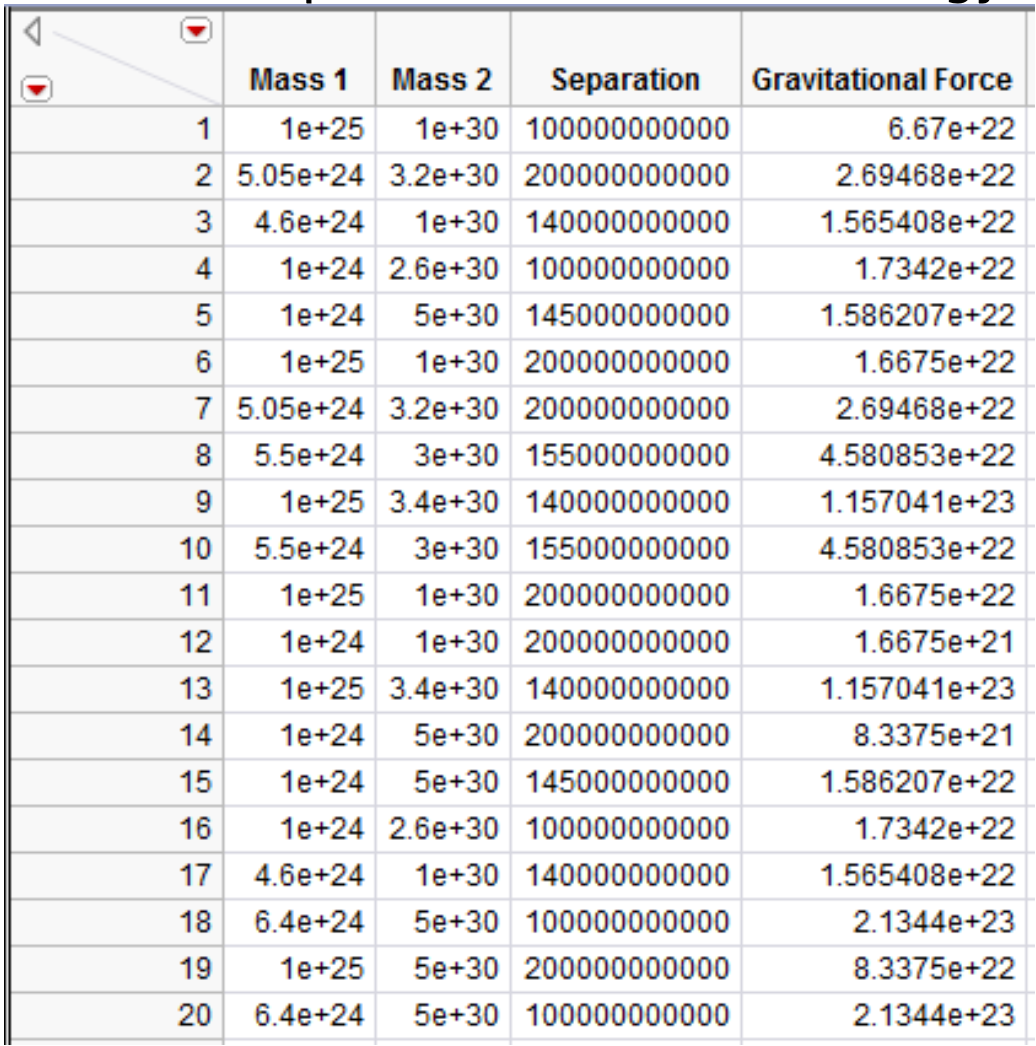 Table 1. An Experiment Design for the Model in Figure 4
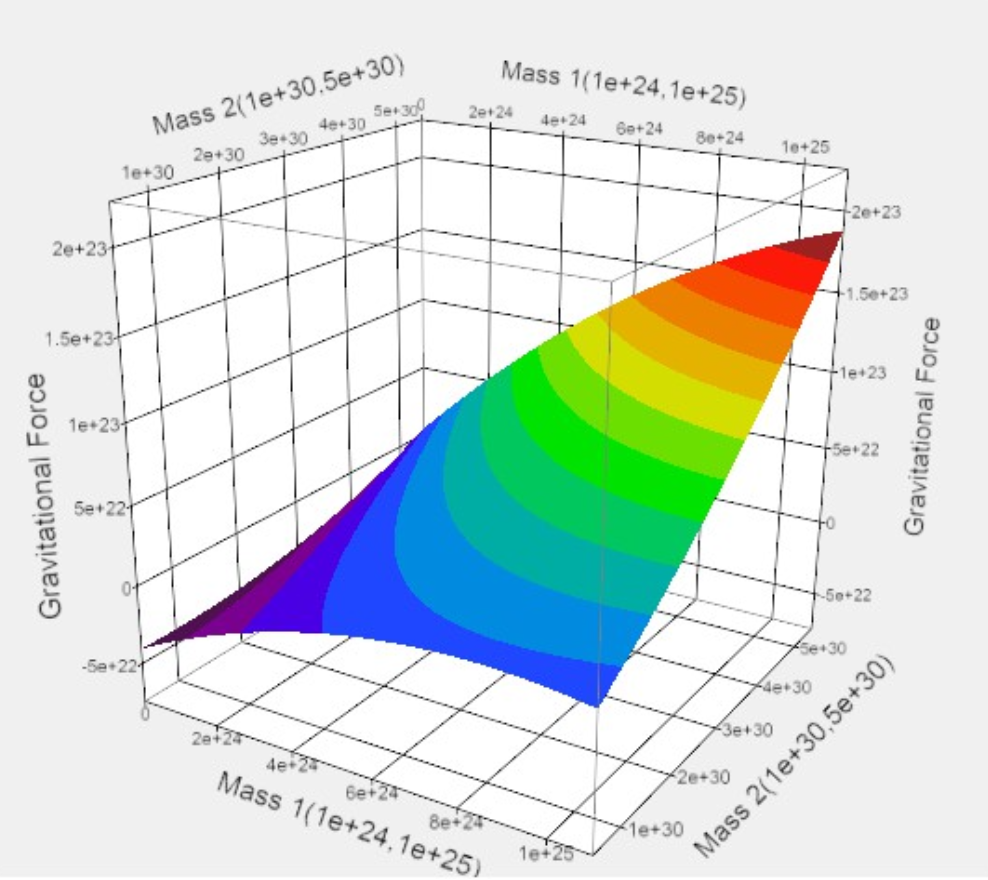 Figure 4. A Response Surface Model
What A Model Does for You
A model lets you predict the results of experiments you have never run, allowing you to be very thorough. It shows you the effect of factor interactions. It also allows you to predict the best conditions for meeting your goals – your Sweet Spot.
DOE + RSM = A Model
DOE provides an objective list of trials that covers the experiments you are interested in (your “cube”) and will provide the information necessary for understanding factor interactions. This list is a very efficient way of collecting the information needed, keeping the cost of experimentation from growing out of control.
RSM provides the means for using the data collected with your designed experiment to build a model that can predict the outcomes of experimental trials you have never run, allowing you to predict the Sweet Spot. This model incorporates the factor interactions.
Learning to Make Models with DOE and RSM Can Be Easy
Design of Experiments and Response Surface Methodology rely heavily on complex math and Statistics. Because of this, DOE and RSM have been the domain of Statisticians. These extremely valuable tools have been hidden from most engineers by math and jargon.
Objective Experiments's specialty is making complex subjects practical. Thanks to the workshop, “Performing Objective Experiments,” and major advances in Statistical software packages, you can learn DOE and RSM with no math and a bare minimum of new terminology. In fact, learning to make models with DOE and RSM can be fun and easy!
Conclusion
In this post you have seen that One-Factor-At-A-Time experimentation suffers from major weaknesses: it is subjective, it isn't thorough, and it ignores factor interactions. Design of Experiments (DOE) and Response Surface Methodology (RSM) can be used to make a model that is thorough and incorporates factor interactions, correcting these weaknesses.
The next time you need to perform an experiment, remember that there is a better way than One-Factor- At-A Time!
Looking for More?
Here are some interesting references for further information:
Kappele, William D., “Effective Innovation Using Design of Experiments”
Kappele, William A., “[Seven Steps to Reducing Failure and Cycle Time: A Design of Experiments case study](www.qualitydigest.com/inside/quality-insider- article/us-synthetic.html),” Quality Digest, June 29, 2009.
Kappele, William D., “Are You Feeling Lucky? Stop Relying on Luck to Optimize Your Pilot Processes,” Proceeding of the 2007 AIChe Spring Meeting & 3rd Global Congress on Process Safety
Kappele, William D, “Quantifying Color Gamut,” Proceedings of IS&T's NIP 13: International Conference on Printing Technologies, Nov. 2-7, 1997, pps. 470-474.
Questions?
If you have questions about this post or are looking for more information, please contact us.