What on Earth is a Weibull?
Abstract
Reliability analysis is essential to developing and manufacturing quality products. Understanding the variability in Reliability lets you make more informed decisions. The Weibull Distribution is a powerful tool for measuring the variability in product reliability and for predicting product life.
Introduction
Reliability analysis lets you measure how long you can expect your products to perform without failing. A “Weibull Distribution” is a very useful tool for making this measurement.
Before looking at what a “Weibull Distribution” is, let's take a look at the problem we need to solve.
Is Your Product Reliable?
A reliable product is trustworthy. It will work when you need it to and it will last. A quality product must be reliable.
You may have noticed that the performance of every product is variable. Sure, an individual unit will behave a certain way, but other, similar units, will have their own unique reliability.
Take car tires as an example. The same brand and make of tire will exhibit different reliability. Please look at Figure1. It shows a plot of the accumulated probability of a tire failing vs. the distance driven.
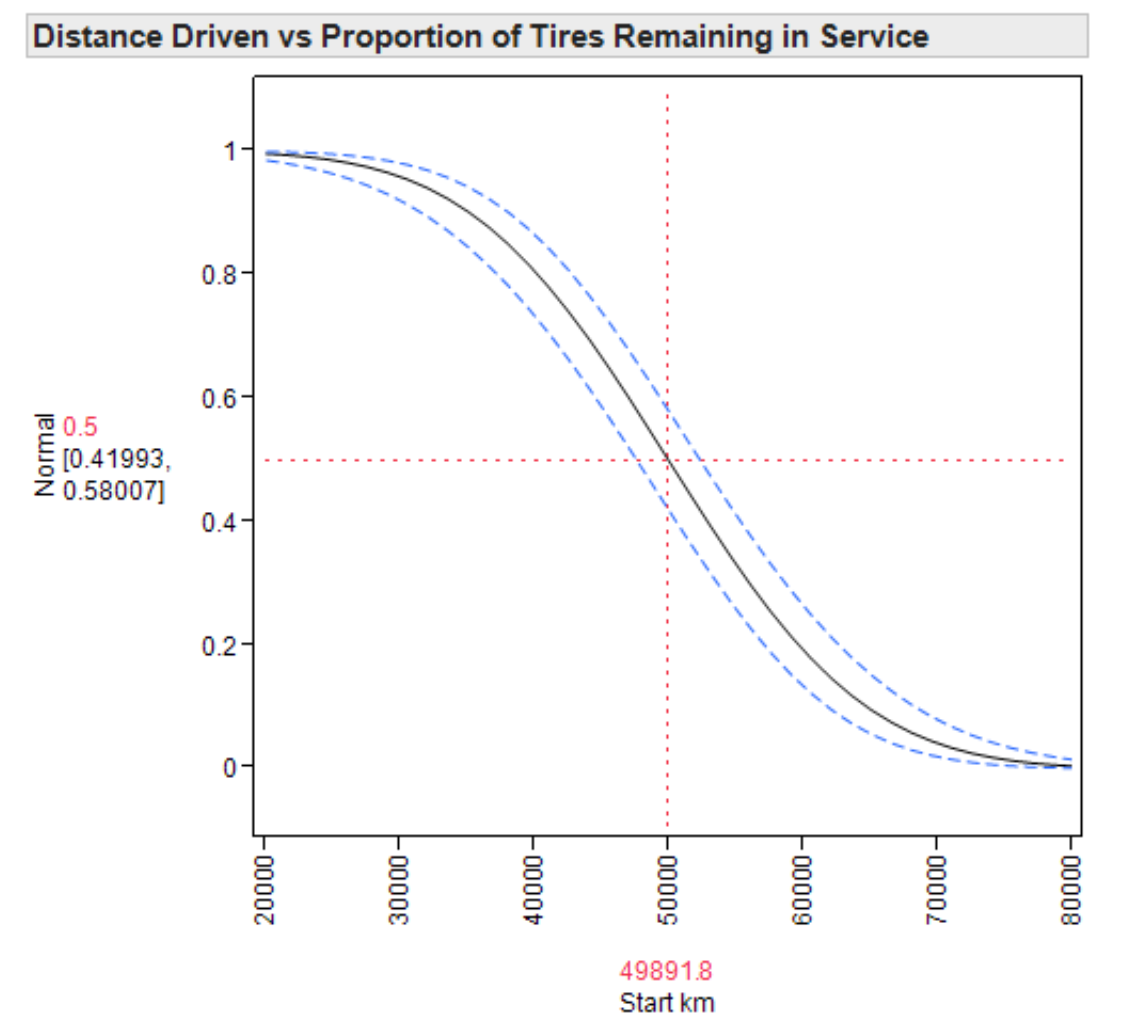 Figure 1. Proportion of tires in service vs distance driven
Here's how you read this curve: on the vertical scale at 50,000 km ( 49,891.8 km to be exact ) the accumulated probability of failing on the horizontal scale is 0.5, or 50% (this is indicated by the red cross-hairs). This means that by 50,000 km half of the tires in the study would have failed.
Product Life is often defined as the point in time when 50% of the product units have failed. In this case, the Product Life is the the distance at which 50% of the tires fail, or approximately 50,000 km.
So this curve tells us that no tires in this study failed by 20,000 km. Shortly after that, a few failed. As people kept driving, some experienced failures at 30,000 km while others did not have their tires fail until over 70,000 km had been driven.
This variability is absolutely normal. In fact, nobody knows how to avoid it. Fortunately, you can measure the variability and the reliability of your product.
The Role of Uncertainty
Just like the tires in Figure 1, all products that should be identical will fail at different times. These failure times tend to follow patterns. If you can understand the pattern of failure, you can predict how reliable your product will be and determine if you are improving this reliability with changes you make to the product or the process that produces it.
Uncertainty in failure time also makes it difficult to determine a reasonable warranty. Understanding the pattern of failure will simplify this task as well.
Product Failure Patterns
Statisticians identify product failure patterns using a different curve that shows the fundamental variability in data. This curve shows instantaneous probability of failure (called the “Density”) vs time to failure. Since people don't drive constantly, it is more convenient to measure “time to failure” as “distance to failure” for tires.
Figure 2 has a curve showing instantaneous probability of failing vs distance driven. At 50,000 km there is a probability of 0.00003457 of a tire failing in the next instant (as shown by the red cross-hairs ). This is very small. “0” would mean no chance of failing and “1” would mean certainty of failing. It's great this number is small. If you have a high probability of a tire failing in the next instant you won't want to be driving on it!
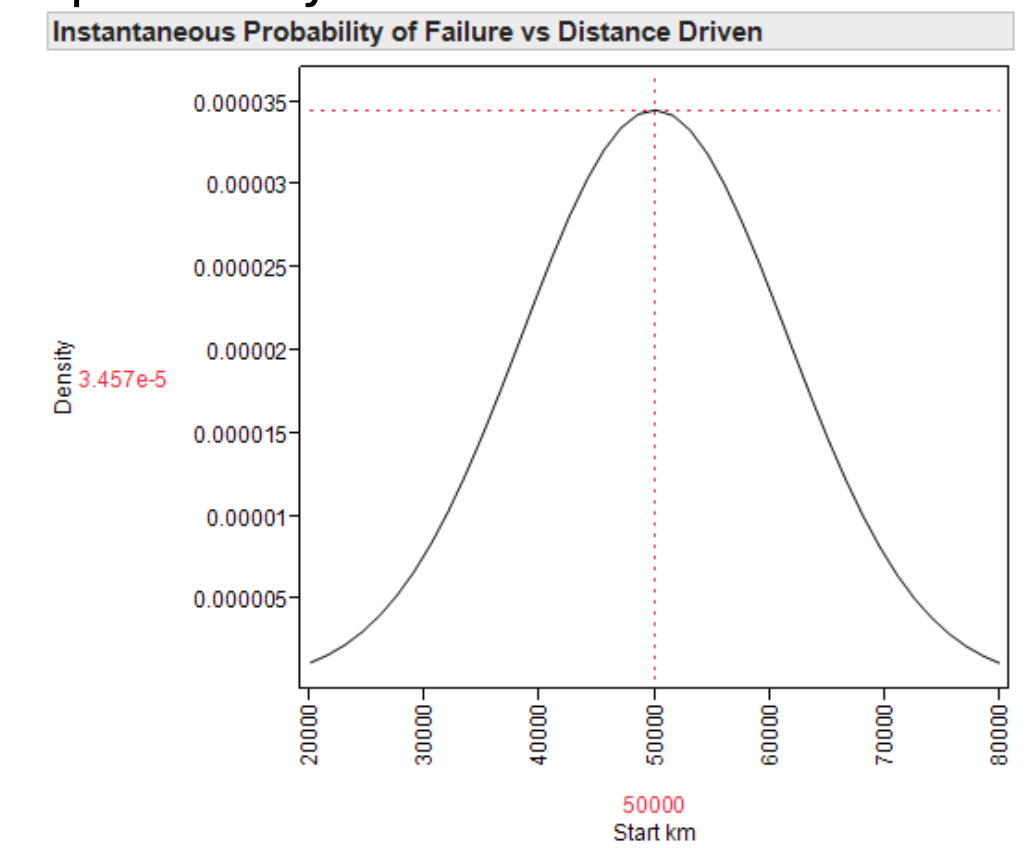 Figure 2. Fundamental uncertainty in tire life
Notice that this curve is shaped like a Bell. The probability of failing in the next instant at 20,000 km is nearly zero. The probability of a tire failing in the next instant is highest at 50,000 km –most of the tires will fail somewhere around 50,000 km. The probability of failing in the next instant at 80,000 km is also nearly zero, but this curve indicates that a tire might actually survive that long.
Figure 2 is just a different view of the same information that is in Figure 1. For most of us Figure 1 is easier to understand, but the pattern of product failure variability is graphed in Figure 2.
What on Earth is a Weibull?
When you plot product failure data on a curve like that in Figure 2, it won't always have a bell shape. In fact, it rarely has a bell shape. Product failure data falls in a variety of patterns. You can see some examples in Figures 3, 4, and 5.
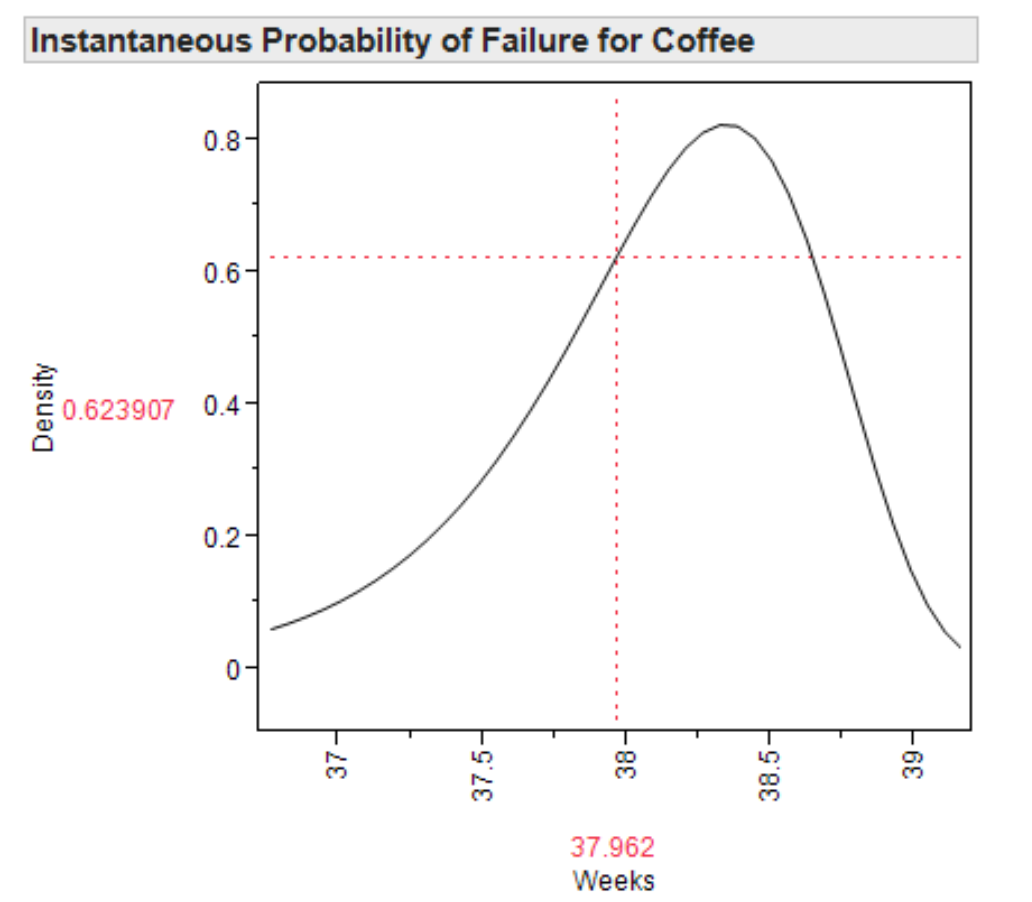 Figure 3. Failure pattern for coffee
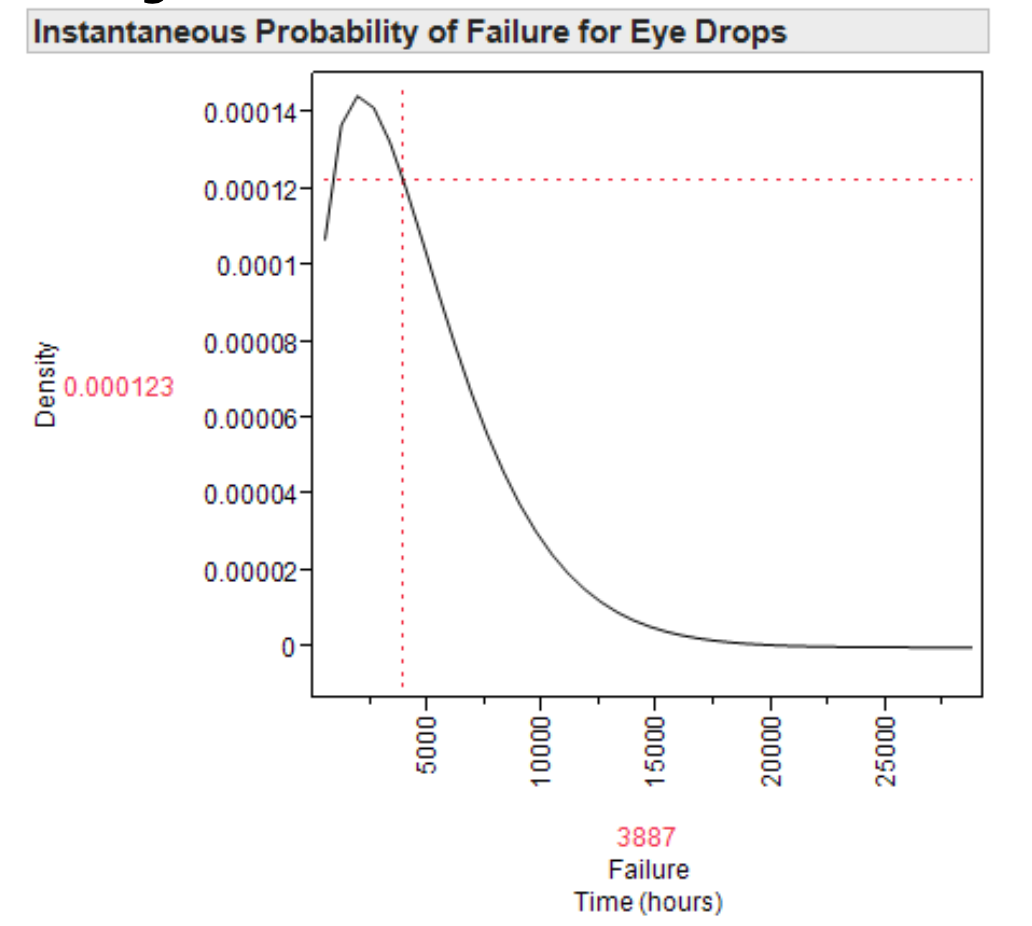 Figure 5. Failure pattern for eye drops
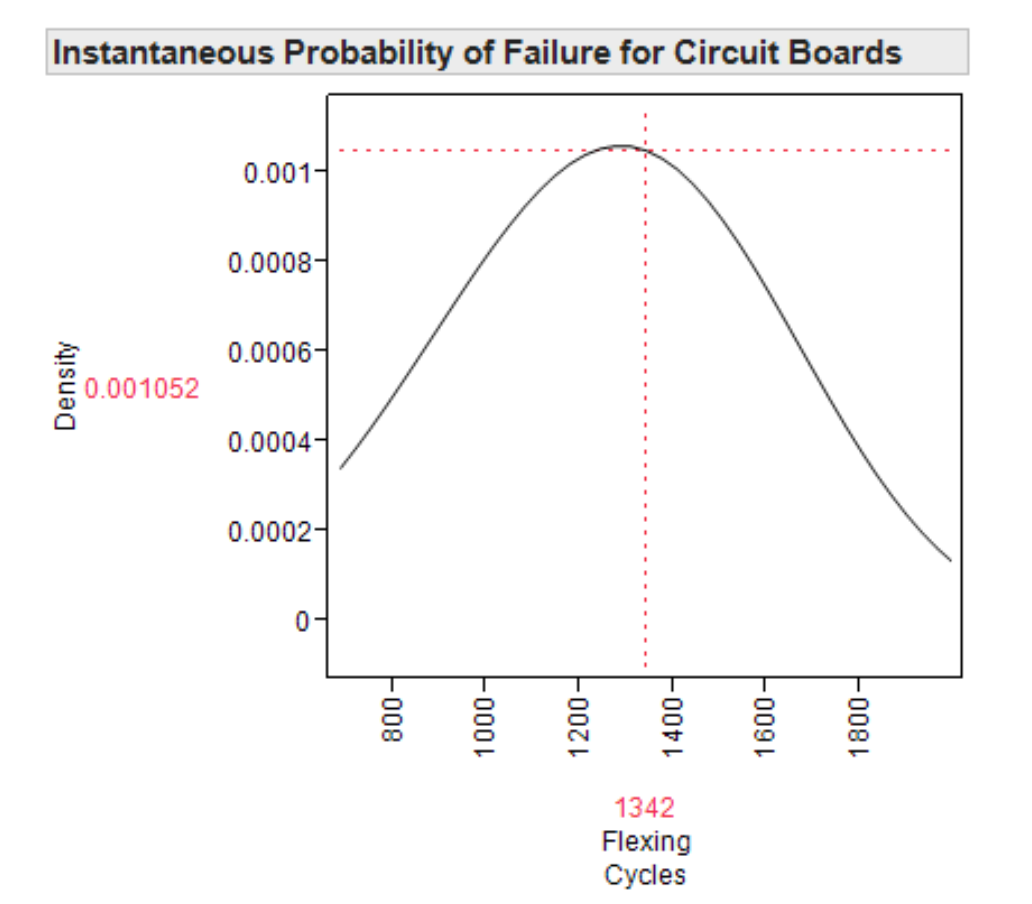 Figure 5. Failure pattern for circuit boards
Waloddi Weibull discovered a very versatile way to describe failure patterns. He taught us how to describe a wide variety of patterns with one equation, called a “Weibull Distribution.” Each of the curves in Figures 3, 4, and 5 is a Weibull Distribution.
What Is A Weibull Good For?
A computer can easily fit your data to a Weibull Distribution. The computer can then use this to create curves like Figure 1–or even better, “Survival Curves.” A “Survival Curve” shows the proportion of units surviving vs time. Figure 6 shows an example of a Survival Curve for the tire study in Figures 1 and 2. Notice that 50,000 km ( 49,891.8 km to be exact ) is now on the horizontal scale and 0.5 (50%) is now on the vertical scale.
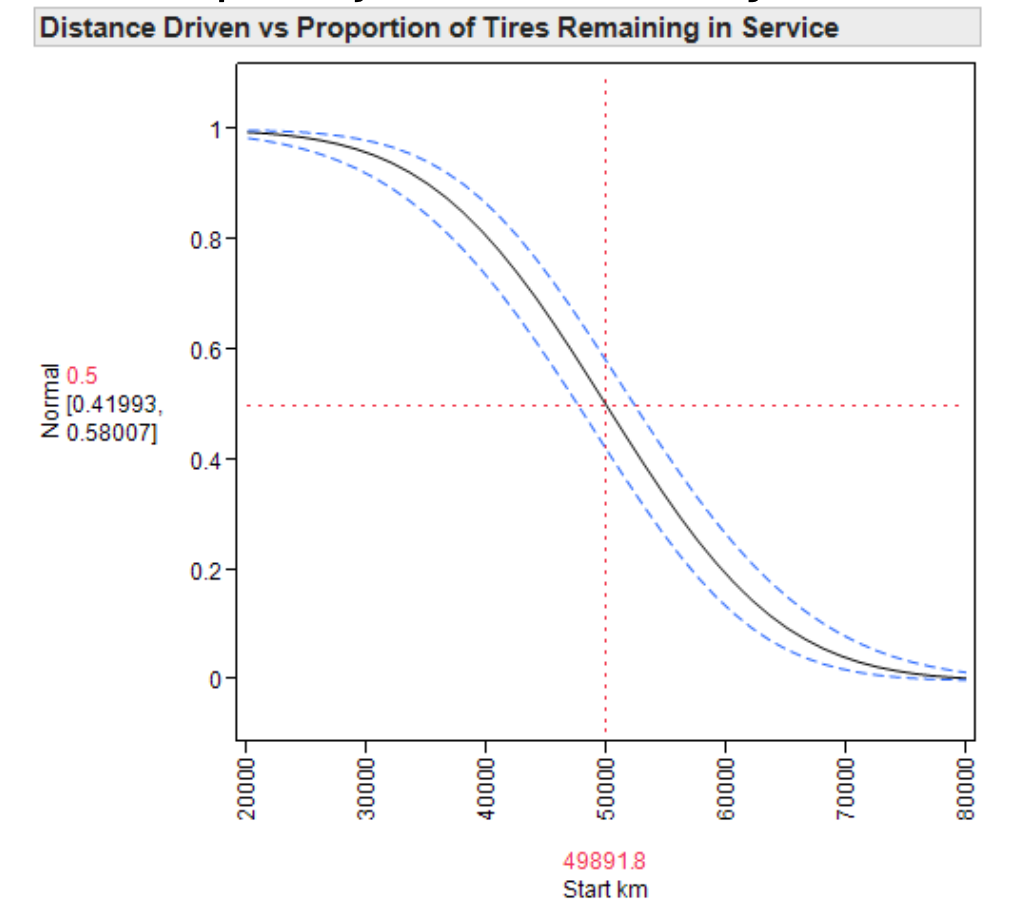 Figure 6. Survival curve for tires
Figures 7, 8, and 9 show Survival Curves for coffee (Figure 3), eye drops (Figure 4), and circuit boards (Figure 5).
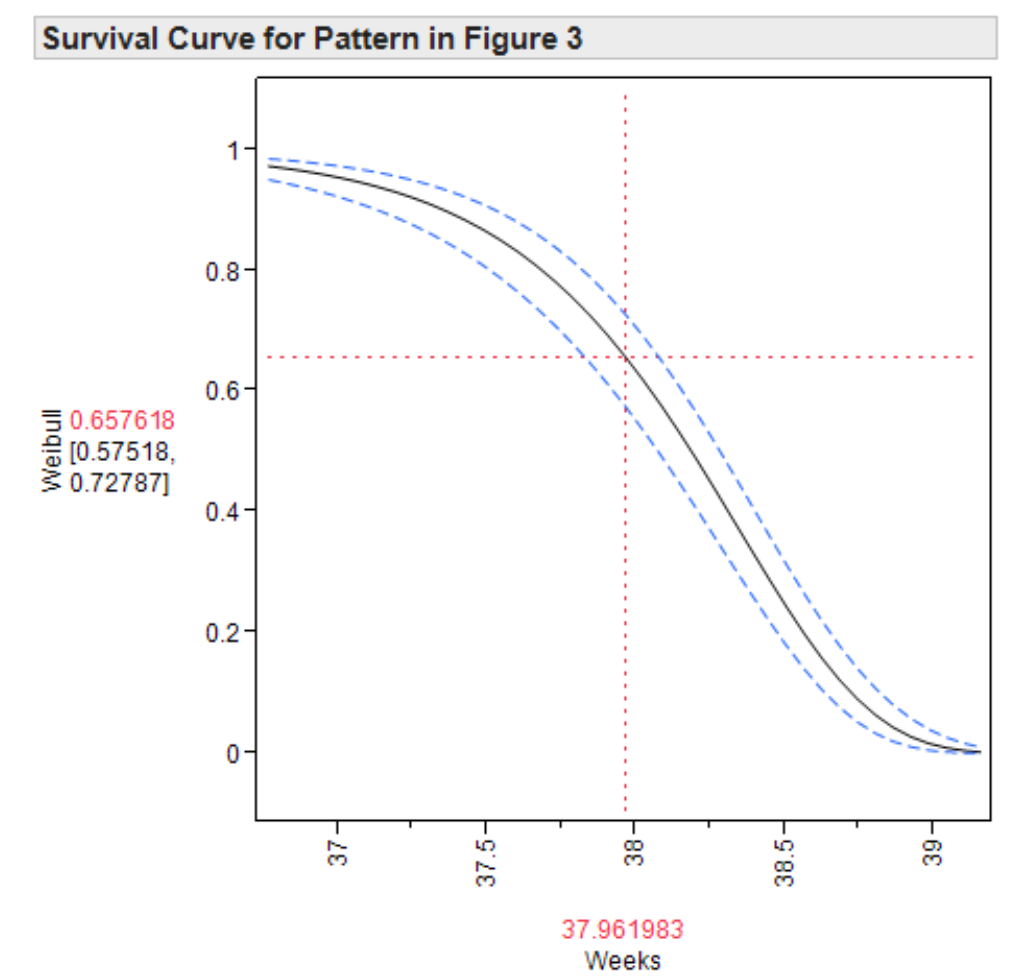 Figure 7. Survival curve for coffee
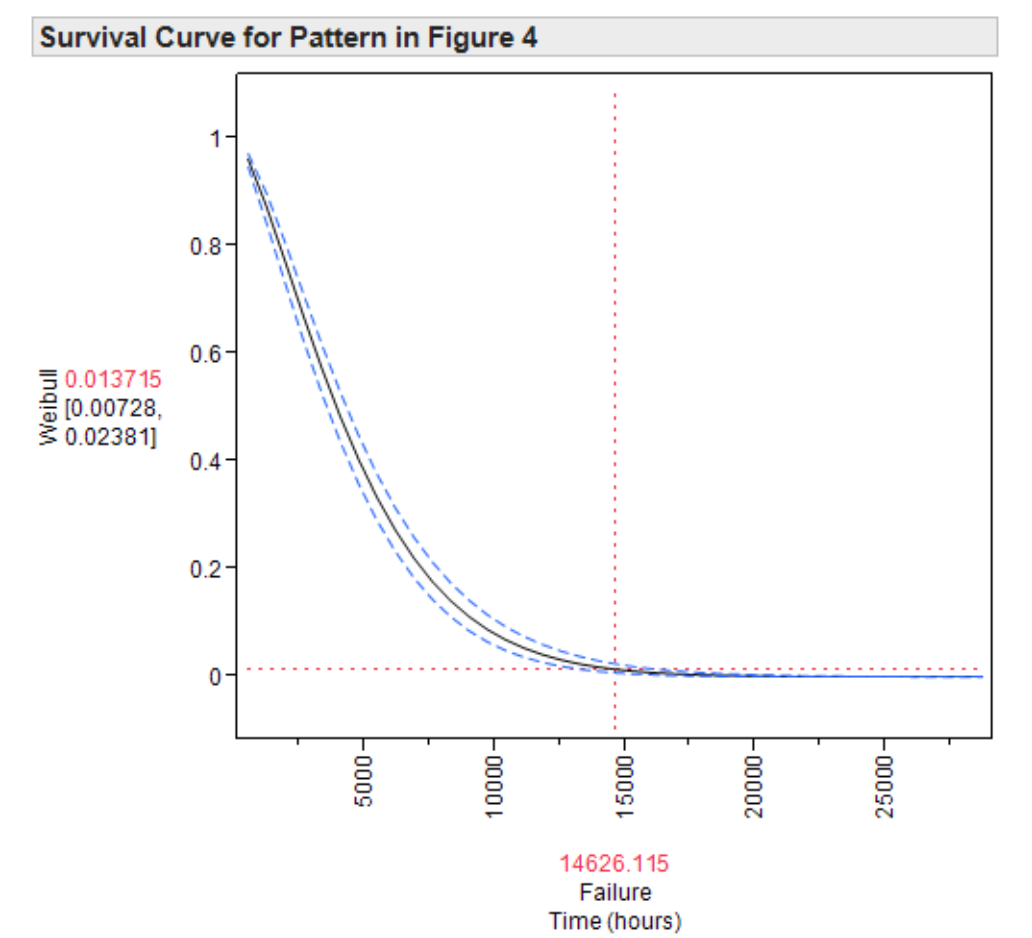 Figure 8. Survival curve for eye drops
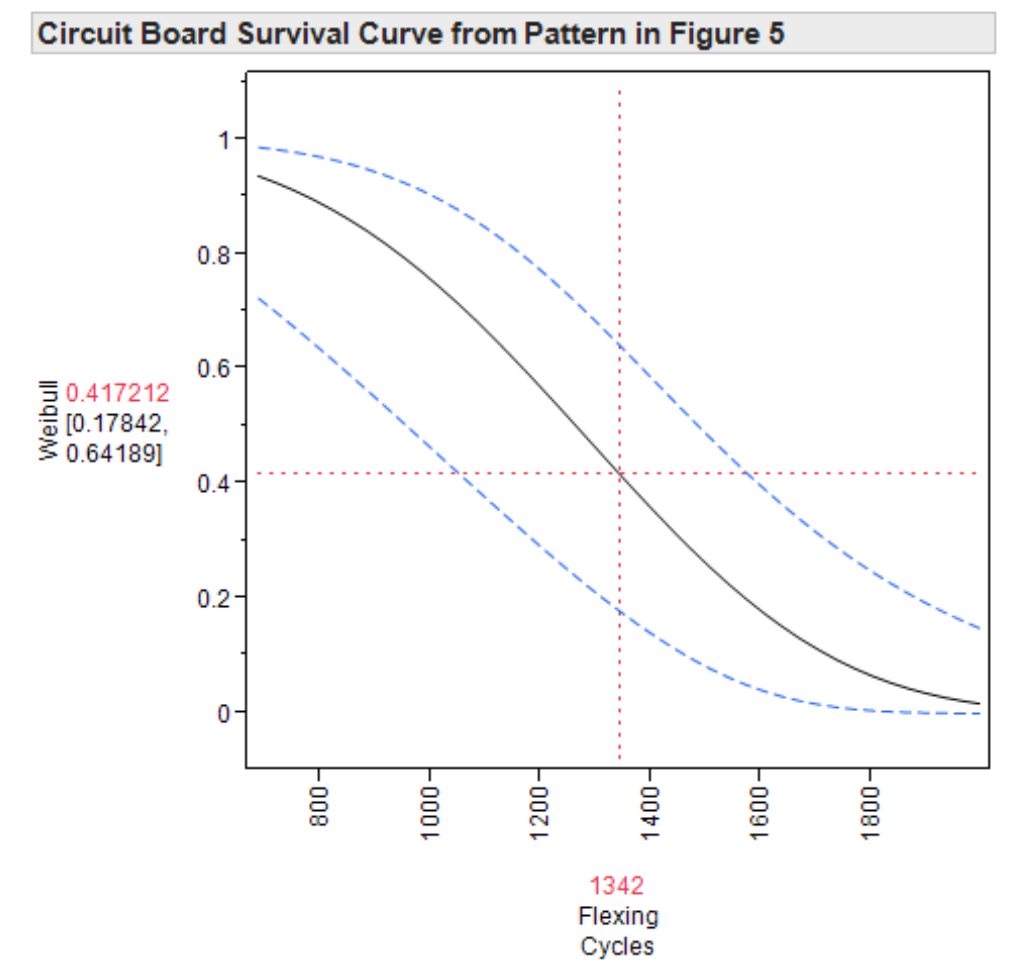 Figure 9. Survival curve for circuit boards
Learning to Use Weibull Distributions Can Be Easy
The Weibull Distribution relies heavily on complex math. Because of this, Reliability Analysis has been a specialized field for engineers who enjoy math. This extremely valuable tool has been hidden from most engineers by math and jargon.
Objective Experiments's specialty is making complex subjects practical. Thanks to the workshop “Objective Reliability Analysis” and major advances in Statistical software packages, you can learn Reliability Analysis - including creating and using Weibull Distributions and Survival Curves - with no math and a bare minimum of new terminology. In fact, learning Reliability Analysis can be fun and easy!
Conclusion
In this post you have seen that you can measure the reliability and life of your products. You can also measure the variability in product reliability.
A Weibull Distribution is a powerful tool for measuring the variability in product failure times that allows you to predict product life.
Looking for More?
Here are some interesting references for further information:
-
Meeker and Escobar, Statistical Methods for Reliability Data, J. Wiley, ISBN 0471143286
-
Trindade and Tobias, Applied Reliability, Third Edition, CRC Press, ISBN 1584884665
-
Silverman, Mike, How Reliable is Your Product?: 50 Ways to Improve Product Reliability, Super Star Press, ISBN 160773060X
-
O'Connor, Patrick, Practical Reliability Engineering, Wiley, ISBN 047097981X
-
Summerville, Nicholas, Basic Reliability: An introduction to Reliability Engineering, Author House, ISBN 1418424188
Questions?
If you have questions about this post or are looking for more information, please contact us.