Can You Trust Your Measurement System?
Abstract
If you are wondering whether you should perform a Measurement System Analysis, ask yourself this question: “Is my data important?” The answer to both questions is the same. Three examples from the real world will be presented: measuring surface tension for inks, measuring copper thickness for printed circuit boards at Hewlett Packard, and measuring diamond cutter wear at US Synthetic. Two of these examples come from the direct experience of the author.
Introduction
Since people began making measurements they have wanted to know if they were accurate. Nature seems to have decreed that all measurements will be uncertain.
In the past, scientists assumed that the problem was due to poor tools —when the measurement tools improved, the uncertainty would vanish. They were wrong—better tools have actually made the uncertainty more evident.
In the mid twentieth century a system of Measurement System Analysis called “Gage R&R” was widely adopted, especially in the automotive industry. Since then engineers have been able to measure the uncertainty inherent in their measurement systems, allowing them to judge if these systems are “good enough.”
Is My Measurement System Good Enough?
You may have paid a lot for your measurement system, but that doesn't mean you can trust it. Every measurement system works well for some applications and poorly for others.
A simple example is a measuring cup. A measuring cup does a great job of measuring a cup of water. It doesn't do such a good job on honey. Sure, you can measure a cup of honey just fine – but you cannot transfer the honey quantitatively. This measurement system isn't useful for honey.
What do I Need to Know About My Measurement Systems?
You need to know if your measurement system is trustworthy for your application. If it is, it will provide high quality data for all of your work. If not, you will be misled by noise and bias.
Noise and bias are the keys to measurement system quality. Noise is error in the gage itself, while bias comes from other sources, such as the people making the measurements.
A gage is any system for making a measurement. It can be a ruler, a clock,or a chemical analysis. Every measurement is made up of at least two parts – signal and noise. Signal is what you are really trying to measure. Noise is error in your measurements that obscure your signal. The lower the noise is, the better.
It turns out that the absolute amount of noise is not that important. If the noise is small compared to what you are trying to measure, then you can trust your measurement system. You need to have measurement systems with a high ratio of signal to noise.
This is one reason why the same measurement system can work well in some situations and poorly in others. As the need for more precise measurements increases, the need for less noise becomes more critical.
Bias causes a measurement to be either too high or too low. Competing sources of bias, like operators who add different amounts of bias, can look like noise. You need to eliminate all known sources of bias.
Sample type also plays an important role. Just as in the water vs honey example above, a measurement system may work well on certain types of samples but not on others. You need to know that you can trust your measurement system with your types of samples.
Systematic Error and Random Noise
Systematic error is error that can be eliminated entirely if it is identified. For example, if someone is making a mistake, correcting the mistake will eliminate the error. If an instrument is drifting, frequent calibration will correct the error. Systematic error shows up as bias. You need to eliminate all sources of systematic error in your measurement systems.
Random noise cannot be eliminated. You can drive it smaller and smaller with better technique and instrumentation, but you can never eliminate it. Random noise must be small compared to what you are measuring.
Measurement system analysis identifies both systematic error and random noise.
Gage R&R
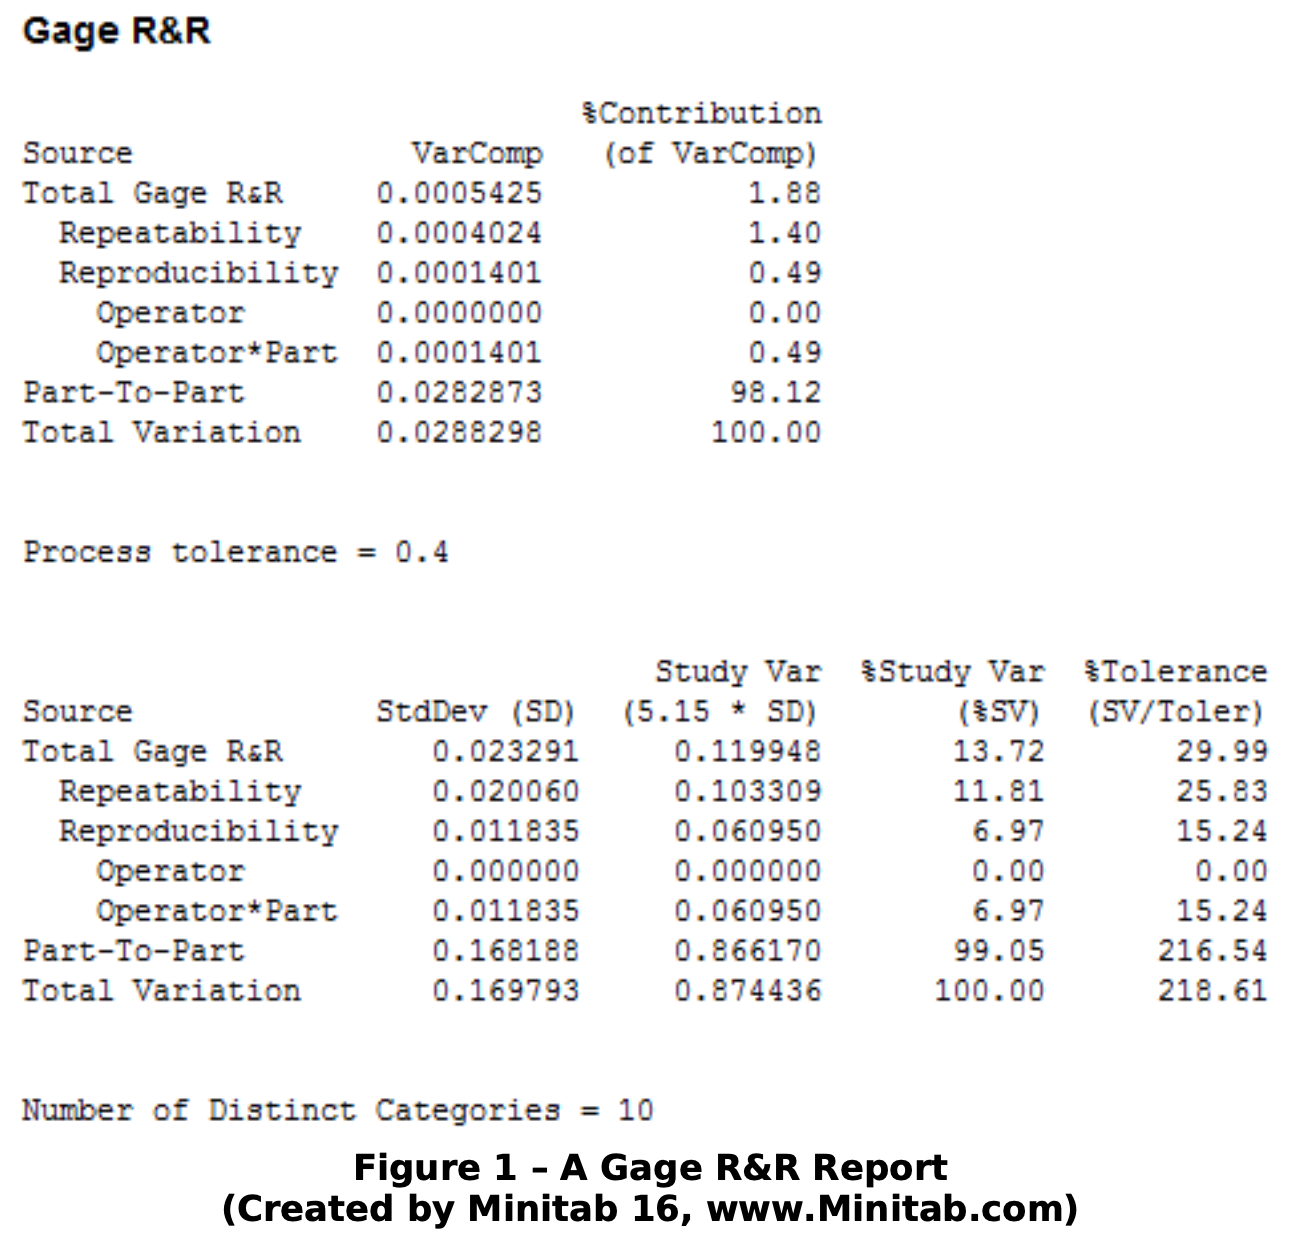
Gage R&R is a methodology that has been around since 1962. R&R stands for “Repeatability and Reproducibility.” “Repeatability” is a measure of the noise in your gage. “Reproducibility” is a measure of the noise due to different people using the same gage. A Gage R&R analysis requires data to be collected in a precise experimental manner to yield useful results. Figure 1 shows a typical Gage R&R report.
EMP
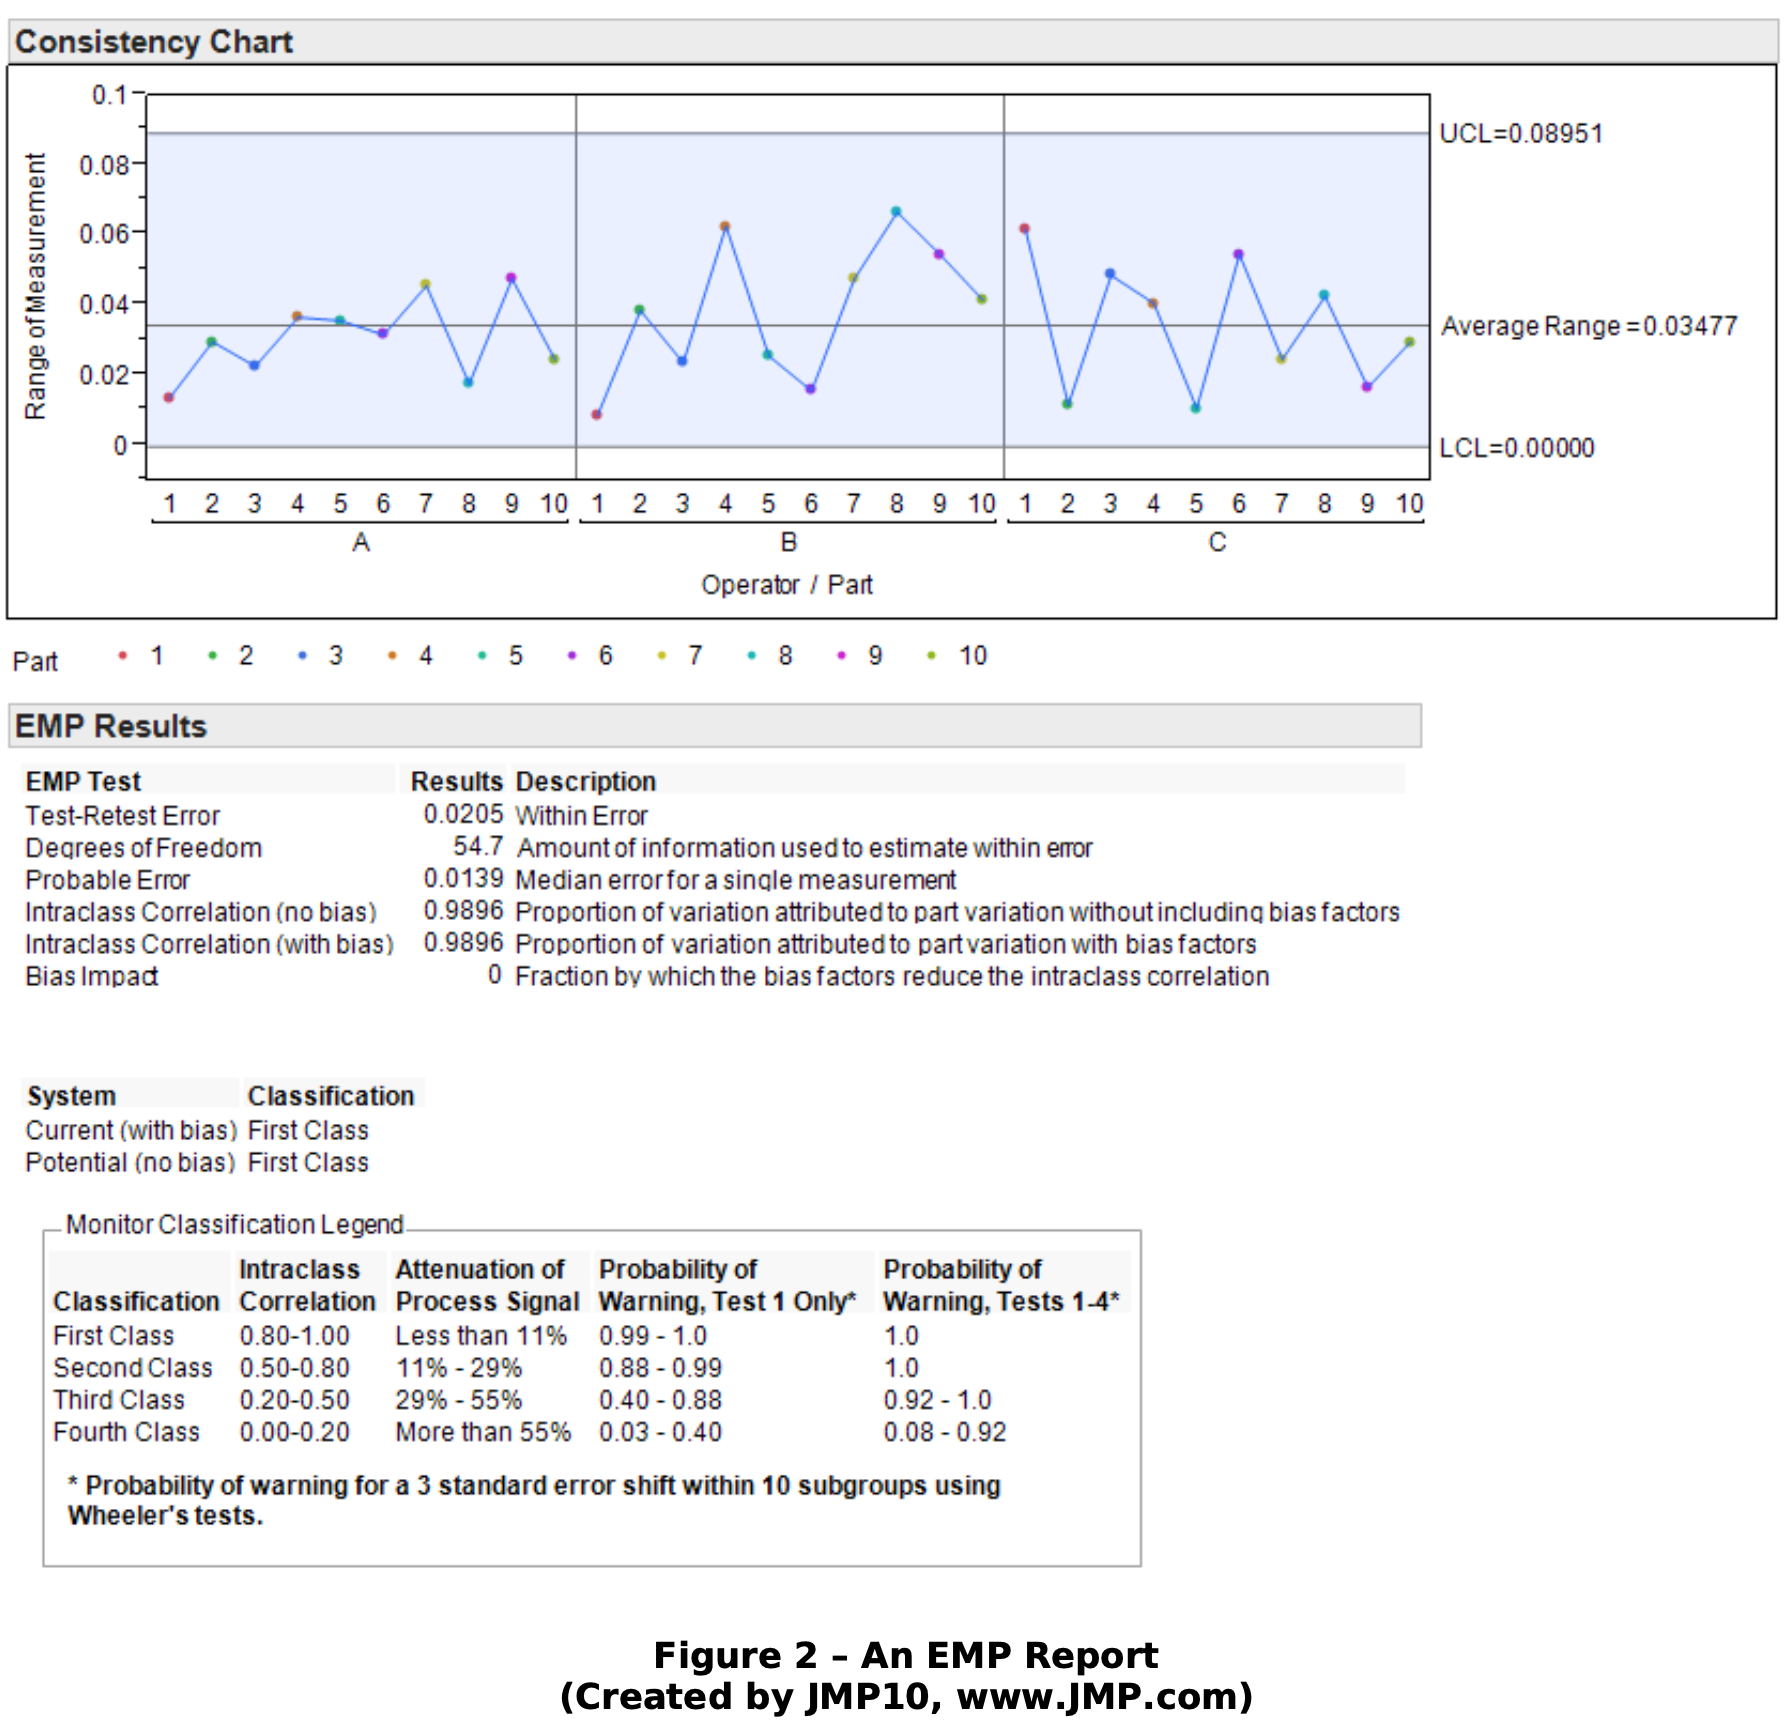
EMP is a much newer methodology created by Donald Wheeler. Dr. Wheeler recognized certain weaknesses of the Gage R&R approach and decided to correct them. His system is officially called “Evaluating the Measurement Process,” or EMP for short. Among the advantages to the EMP approach is that you can use existing, or “observational” data to learn a great deal about your measurement system–a potential money-saver. You are still better off collecting data for a thorough analysis using a carefully designed experiment, but it's nice to have an option. EMP will provide all of the information available from a Gage R&R analysis. Figure 2 shows a typical EMP report.
Example 1: Hewlett Packard I – Problem with the Ink or with the Measurements?
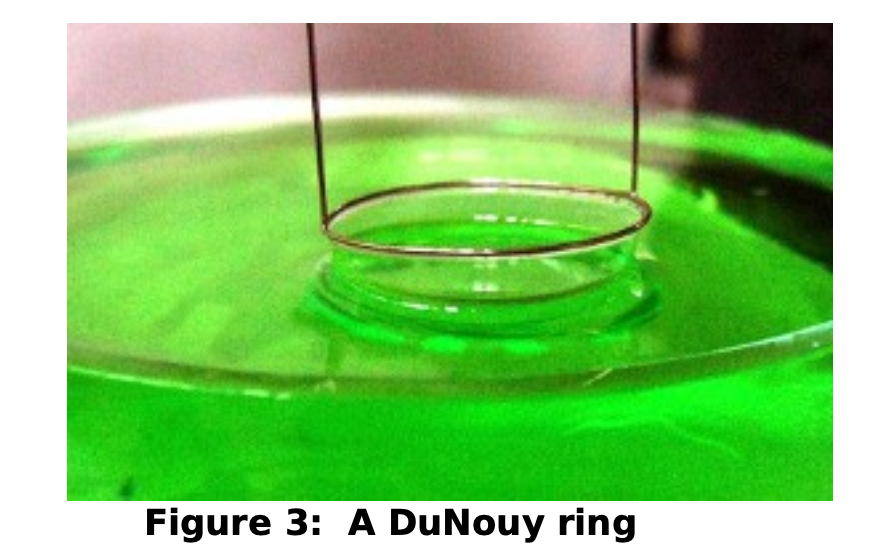
My first job as a chemist was developing Thermal Ink-Jet inks at Hewlett Packard. When I arrived, technicians in the lab measured the surface tension of ink using a DuNouy ring (Figure 3). This ring hung from a balance and was dipped into the ink. The balance pulled on the ring until it broke free from the surface of the ink. The force required was calibrated to read out in surface tension.
This technique works extremely well with water samples, and since the inks we were developing were water based, it seemed like this was the perfect measurement system. I had never heard of Measurement System Analysis, so I was blissfully ignorant that my data was compromised. One day a conscientious technician took me aside. She had noticed that the surface tension of the inks was decreasing throughout the day. Did we have a stability problem?
This seemed extremely unlikely, based on the ingredients in the ink. It seemed more likely that we were somehow contaminating the samples as the day progressed. Maybe the compressed air they dried the ring with had a trace of oil in it? We began drying the ring with canned air–like you use to dust a computer keyboard–but this didn't help.
After a lot of head scratching we finally considered that the ink might not be cleaning off the ring entirely. Could an invisible coating of one of the ingredients be building up throughout the day and causing the problem?
We began using a more aggressive cleaning technique between samples–one that would not normally be used–and this solved the problem entirely.
Had I known about Measurement System Analysis I would not have been relying on faulty data for so long.
Example 2: Hewlett Packard II – Operator Variability or Noise?
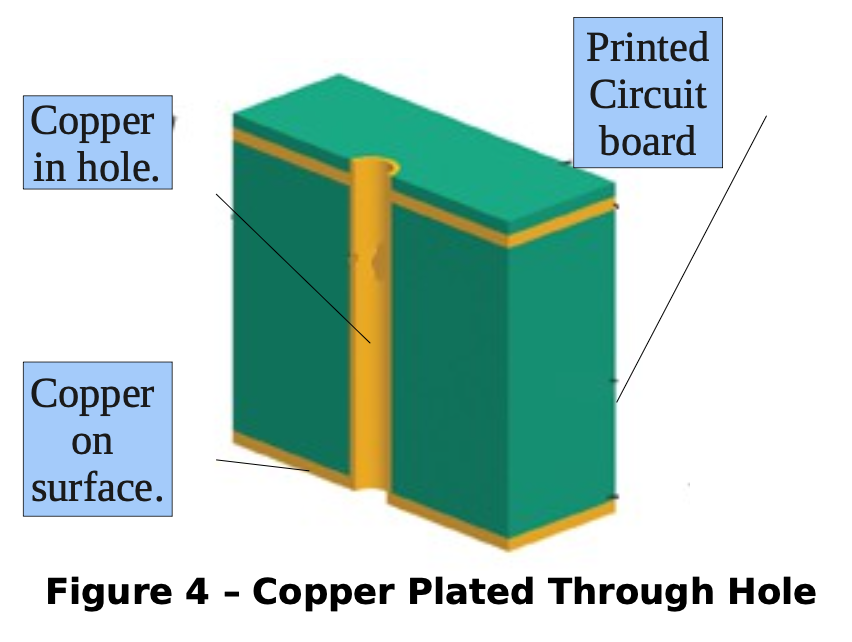
Later in my career I was the Electroplating Engineer on a production line that produced printed circuit boards. We plated copper in holes drilled through the boards to make a continuous electrical connection from one side of the board to the other (Figure 4). We measured the thickness of this copper using a gage with a small pin that was inserted into the hole. A digital readout displayed the thickness.
Our plant Statistician wanted to perform a Measurement System Analysis on this measurement system. This was the first time I had ever heard of such a thing, so I was eager to learn. It seemed likely that we would pass easily-How could anything go wrong with such a simple system?
Well the gage performed very well as expected – but we failed the analysis! The error introduced by the operators using the gage was large.
This was a surprising result. All the operators had to do was insert a pin in a hole. How could they do this wrong?
Careful observation revealed that how fast the pin was inserted in the hole was critical. After teaching the operators to insert the pin at the same speed, the problem was eliminated.
Example 3: US Synthetic – Bias, Noise, or Something Else?
US Synthetic makes diamond cutters for oil well drill bits. They test the reliability of their cutters by cutting granite for a specified time under specified conditions and measuring the amount of diamond lost from the cutter (Figure 5).
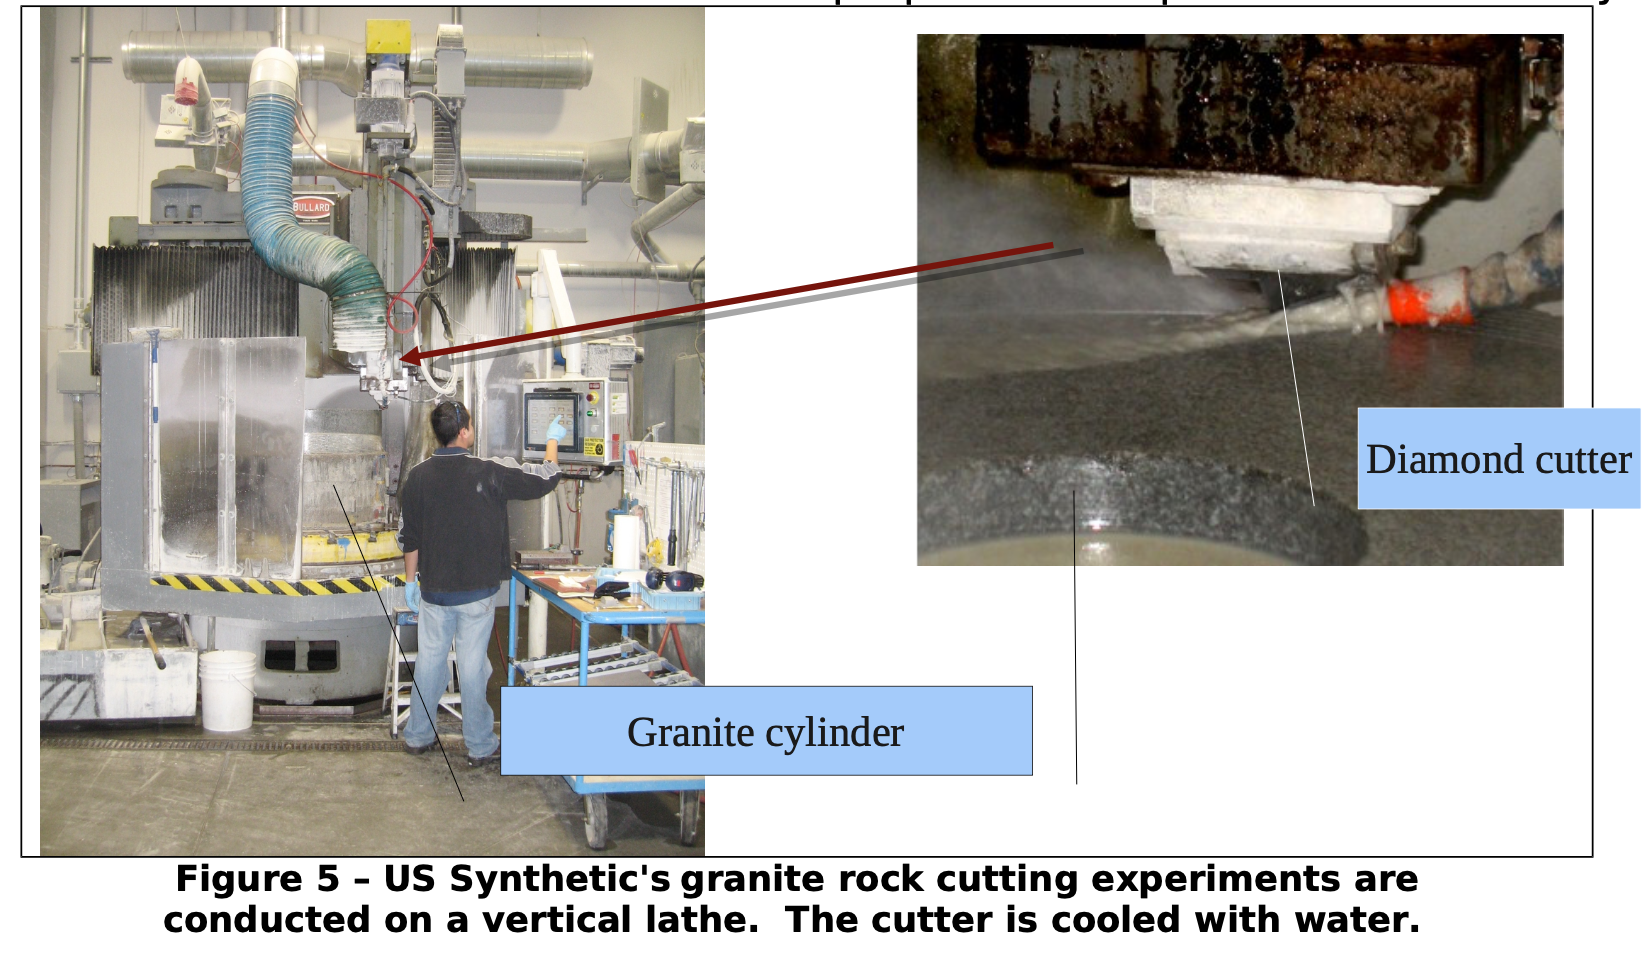
They noticed that this measurement was very noisy. Naturally they wanted to know if this was due to the way they made their cutters, or due to the noise in the measurement system. They decided to perform a Measurement System Analysis.
This Measurement System Analysis was more complicated than most. It involved a sample preparation step (cutting the granite) and a measurement step (determining the amount of diamond lost). The sample preparation step looked at variability in the rock and the operator. The measurement step looked at variability in the gage and the technician.
The results were surprising – the measurement system was untrustworthy for an unusual reason– an interaction between the operator and the rock was the major source of noise!
At first this seemed impossible. How could a huge piece of granite interact with a man? Yet that is what the data indicated.
The granite cylinder starts out about 6 feet tall. By the time it is used up it is about 4 inches high. Careful observation revealed that tall operators had difficulty with short granite and shorter operators had difficulty with tall granite–the rock-operator interaction!
New procedures were implemented to make it easier for operators of all heights to prepare the cutters for measurement, significantly improving the measurement system.
Learning Measurement System Analysis Can Be Easy
Measurement System Analysis relies heavily on Statistics. Because of this, Measurement System Analysis has been primarily practiced by Statisticians and engineers who enjoy math. This extremely valuable tool has been hidden from most engineers by math and jargon.
Objective Experiments's specialty is making complex subjects practical. Thanks to the workshops, “Practical Measurement System Analysis” and “Practical Measurement System Analysis–EMP,” and major advances in Statistical software packages, you can learn Measurement System Analysis with no math and a bare minimum of new terminology. In fact, learning Measurement System Analysis can be fun and easy!
Conclusion
In this paper you have seen that Measurement System Analysis (MSA) helps you judge whether your measurement system is trustworthy and, if it isn't, what needs fixing. You have also seen three examples of untrustworthy measurement systems in industry.
References Burdick, Borror, and Montgomery, Design and Analysis of Gage R&R Studies, ISBN 0-89871-588-1. Wheeler, Donald J., EMP III: Evaluating the Measurement Process & Using Imperfect Data, ISBN 0-945320-67-1.
Wheeler, Donald J., “An Honest Gauge R&R Study,” SPC Press, spcpress.com/pdf/DJW189.pdf De Mast and Trip, “Gauge R&R Studies for Destructive Measurements ,” Journal of Quality Technology, Vol. 37, No. 1, January 2005, pps. 40-49. Windsor, Samuel E., “Attribute Gage R&R,” Six Sigma Forum Magazine, August 2003, pps. 23-28