Is Your Product Reliable?
You can't manage what you can't measure -- W. Edwards Deming
Abstract
Before World War II engineers had very crude methods for measuring reliability. Now engineers are able to measure product reliability and life, allowing them to design products of high reliability and improve the reliability of existing products. You will see three examples of the use of Reliability Analysis in industry.
Introduction
Quality and Reliability, like love and marriage, “go together like a horse and carriage–you can't have one without the other.” Customers must be able to rely on your product not to fail for at least some period of ownership. If a new car will fail at any time, why buy new?
Before World War II, engineers had only crude methods for measuring product reliability. During the War the science of Reliability or “Survival” Analysis was first developed. Since then Reliability Analysis has evolved to the point where you can measure accurately how long you can expect your products to perform without failing.
Is Your Product Reliable?
A reliable product is trustworthy. It will work when you need it to and it will last. A quality product must be reliable.
Have you noticed that the performance of every product is variable? Sure, an individual unit will behave a certain way, but other, similar units will have their own unique reliability.
Take car tires as an example. The same brand and make of tire will exhibit different reliability. Figure 1 shows a plot of distance driven vs. proportion of tires still in service.
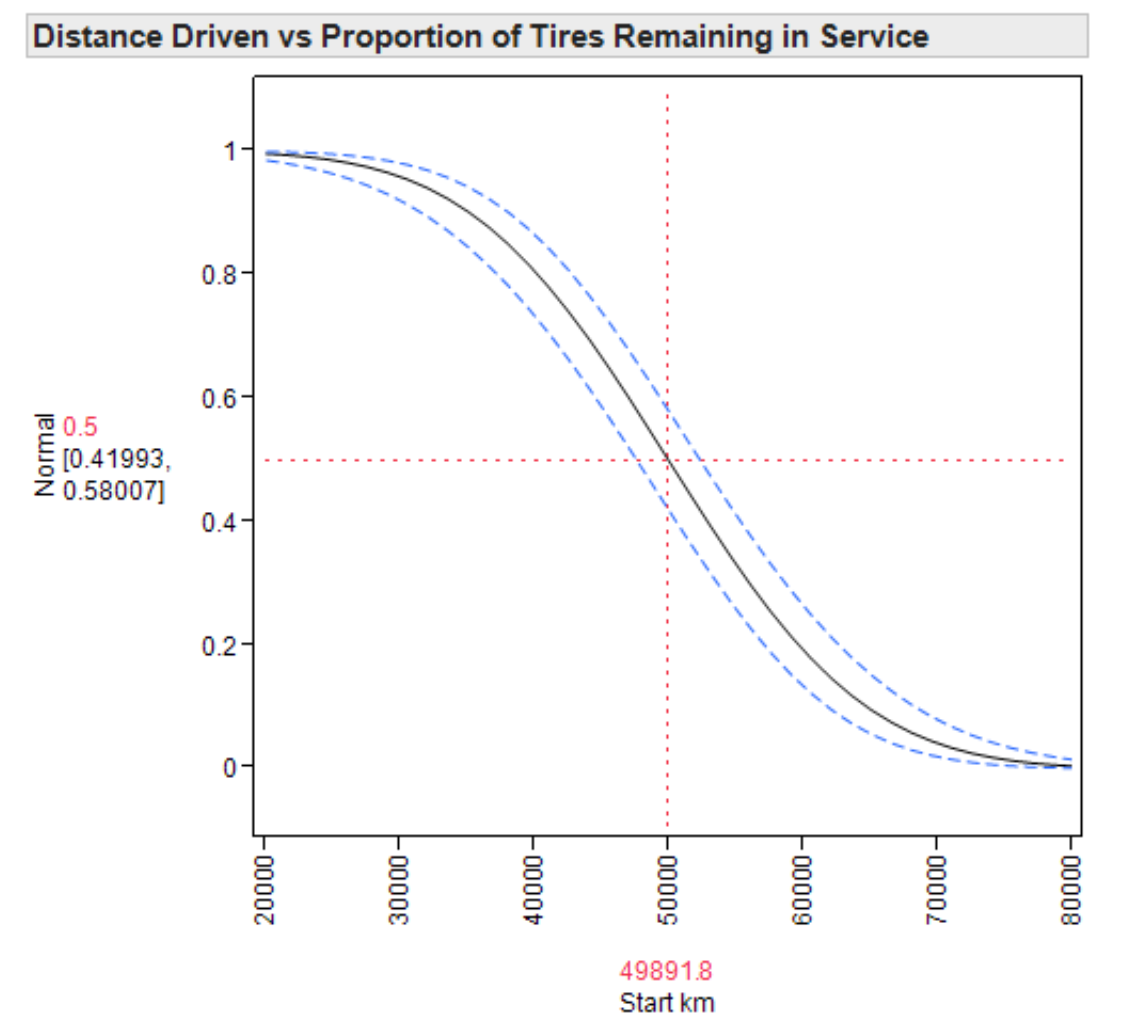 Figure 1. Proportion of tires in service vs distance driven
The scale on the left runs from 0 to 1. “0” represents no surviving tires– all have failed. “1” represents all tires still in service. The scale along the bottom is the number of kilometers driven.
As you can see, all of the tires of this brand and model plot at “1” at 20,000 km–they will all last 20,000 km. After that, a few will fail–the curve drops to less than 1. As people keep driving, some will experience failures at 30,000 km while others will not have their tires fail until nearly 80,000 km. Half of the people driving on this brand and model of tire will experience a failure by 49,891 km, as shown by the red cross- hairs on the graph–the point where you see 0.5 on the vertical axis..
This variability is absolutely normal. In fact, nobody knows how to avoid it. Fortunately, you can measure the variability and the reliability of your product.
You Can't Fix What You Can't Measure
Being able to measure product reliability is essential because you can't fix what you can't measure. Are the changes you are making to your product and the process that produce it improving reliability? Just like there's no such thing as too happy, there's no such thing as too reliable.
The Role of Uncertainty
Like the tires in Figure 1, products that should be identical will fail at different times (different distances driven). Also as in Figure 1, these failure times tend to follow patterns. You need to understand the pattern of failure before you can make necessary improvements.
Uncertainty in failure time makes it difficult to determine a reasonable warranty. Understanding the pattern of failure will simplify this task as well.
What is “Product Life?”
Product Life is how long you can expect a product to last. One common definition is the time until half of all like products fail–the median time to failure. Understanding the pattern of failure will allow you to estimate this time.
Using this definition you can predict the time when half of your customers will experience product failure.
Survival Curves
Presenting the results of your Reliability studies can be challenging. You want your audience to understand you quickly, clearly and easily.
A Survival Curve provides just the graph you need. Figure 2 is a Survival Curve. It plots the proportion of product survivors vs. the time to fail.
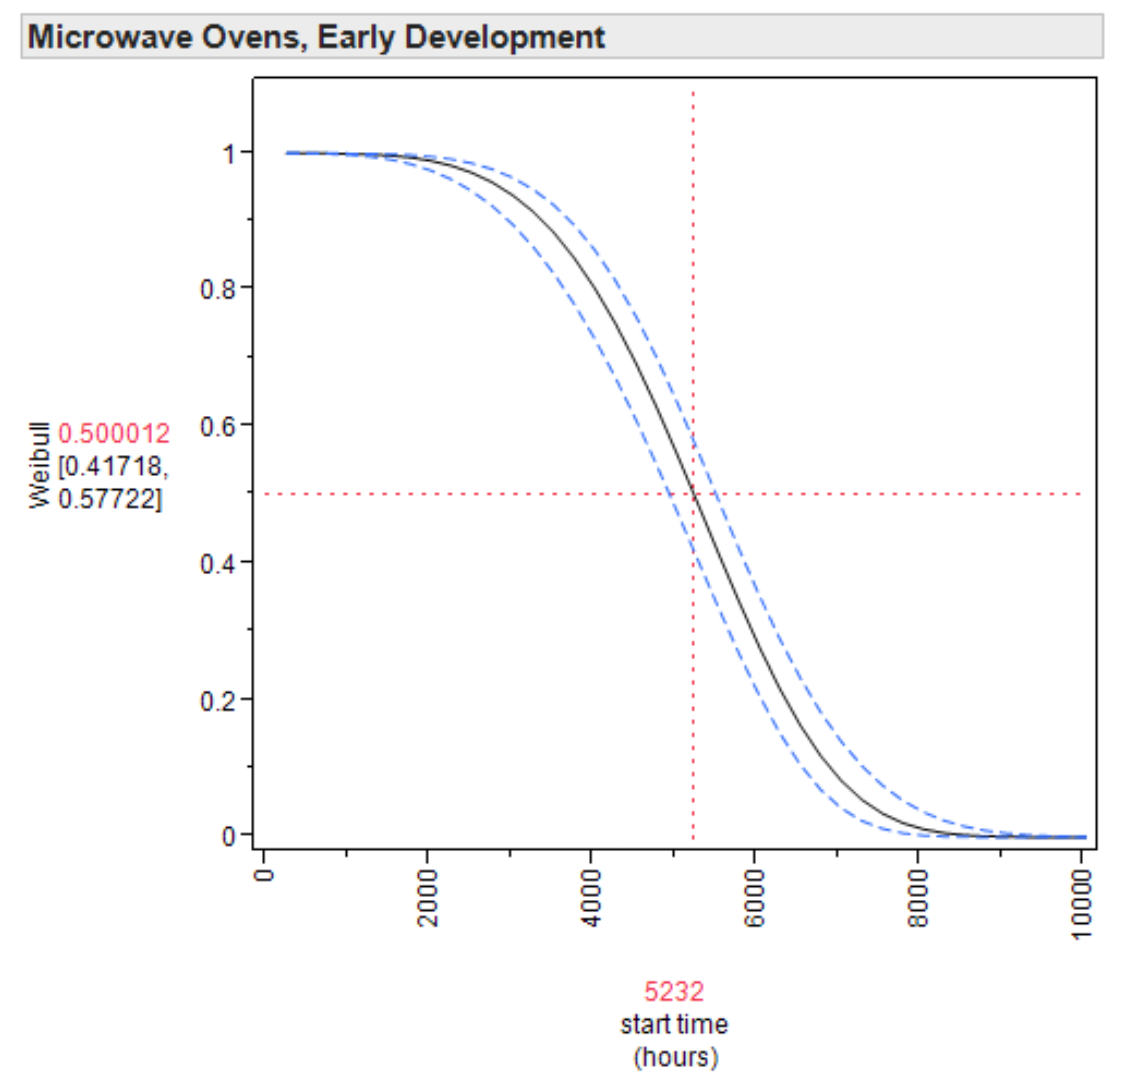 Figure 2. Survival curve for a microwave oven early in the development cycle
You can use Survival Curves to show improvement in the reliability of a product. Figure 2 shows the Survival Curve for a microwave oven in its early stages of development. The goal is for half the ovens to last 7,000 hours. Figure 3 shows the same product near the end of the development cycle.
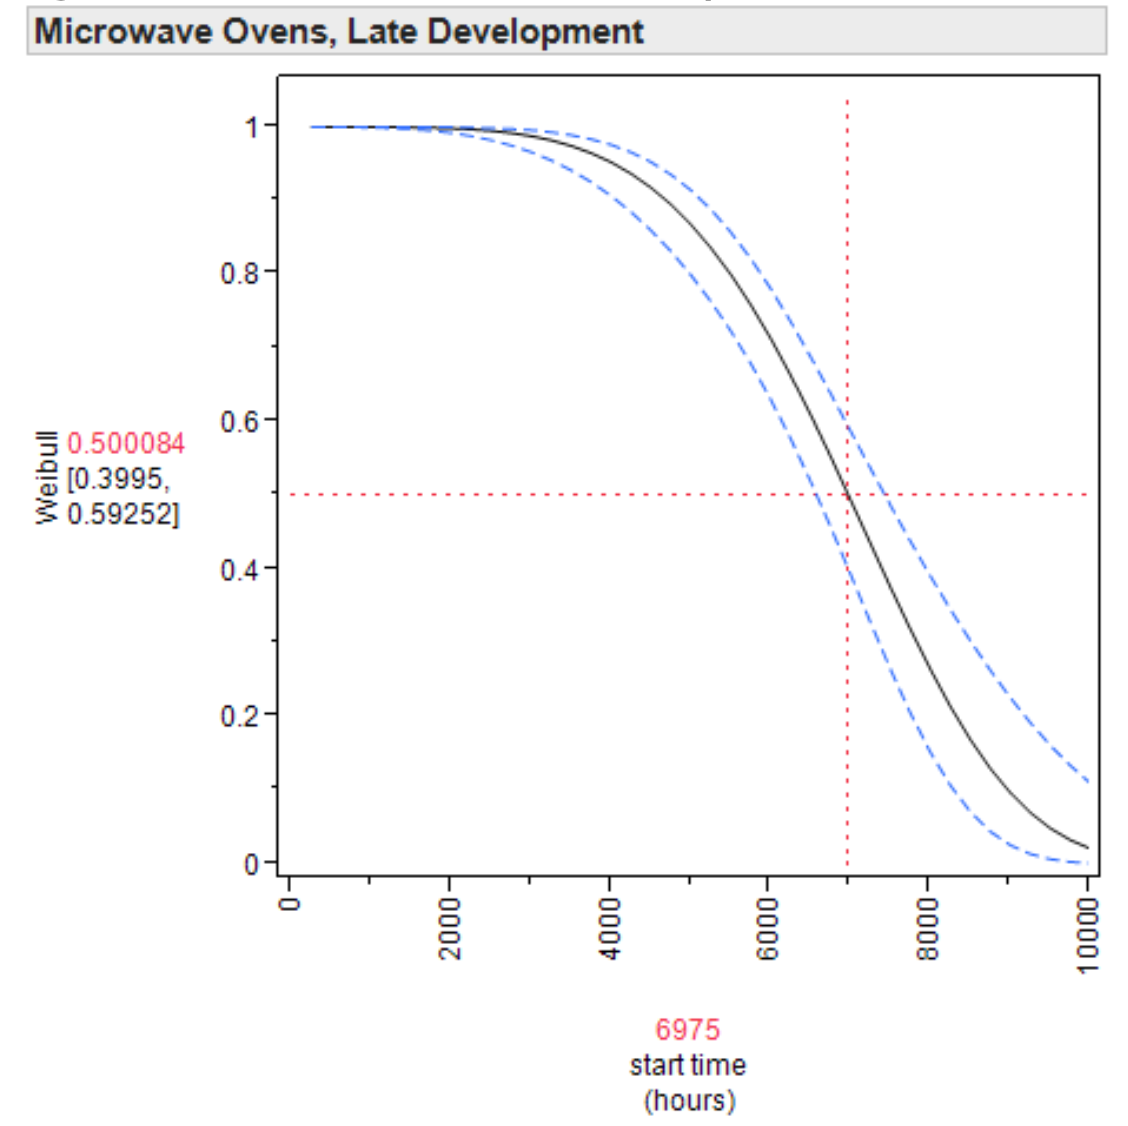 Figure 3. Survival curve for late development of a microwave oven
Notice how the expected life of the microwave oven has increased. Half of the ovens produced in the early stage were expected to last 5,232 hours (shown by the red cross-hairs). By the end of development, half the ovens were expected to last 6,975 hours (shown by the red cross-hairs), a 25% improvement that nearly achieved the development goal.
Compare the shapes of the survival curves in Figures 2 and 3. They show the improvements in oven development that result in the ovens lasting much longer before any fail. Notice that in Figure 2 the curve begins dropping from “1” by 2,000 hours. In Figure 3 it doesn't begin dropping until 3,000 hours. Remember, these curves represent microwave ovens, so later in development the ovens are lasting an extra 1,000 hours before any of them fails. Also, in Figure 2 nearly all of the ovens have failed by 7,000 hours, while in Figure 3 only about half of the ovens have failed by this time.
Example 1: Pillsbury–Shelf Life for Coffee
Pillsbury needed to know the shelf-life (Product Life) of coffee. They knew that exposure to air was hard on coffee, so they packed it in a vacuum to keep it fresh. They needed to know what would happen to the coffee after the customer opened it and it was exposed to air. The results are shown in Figures 4 and 5.
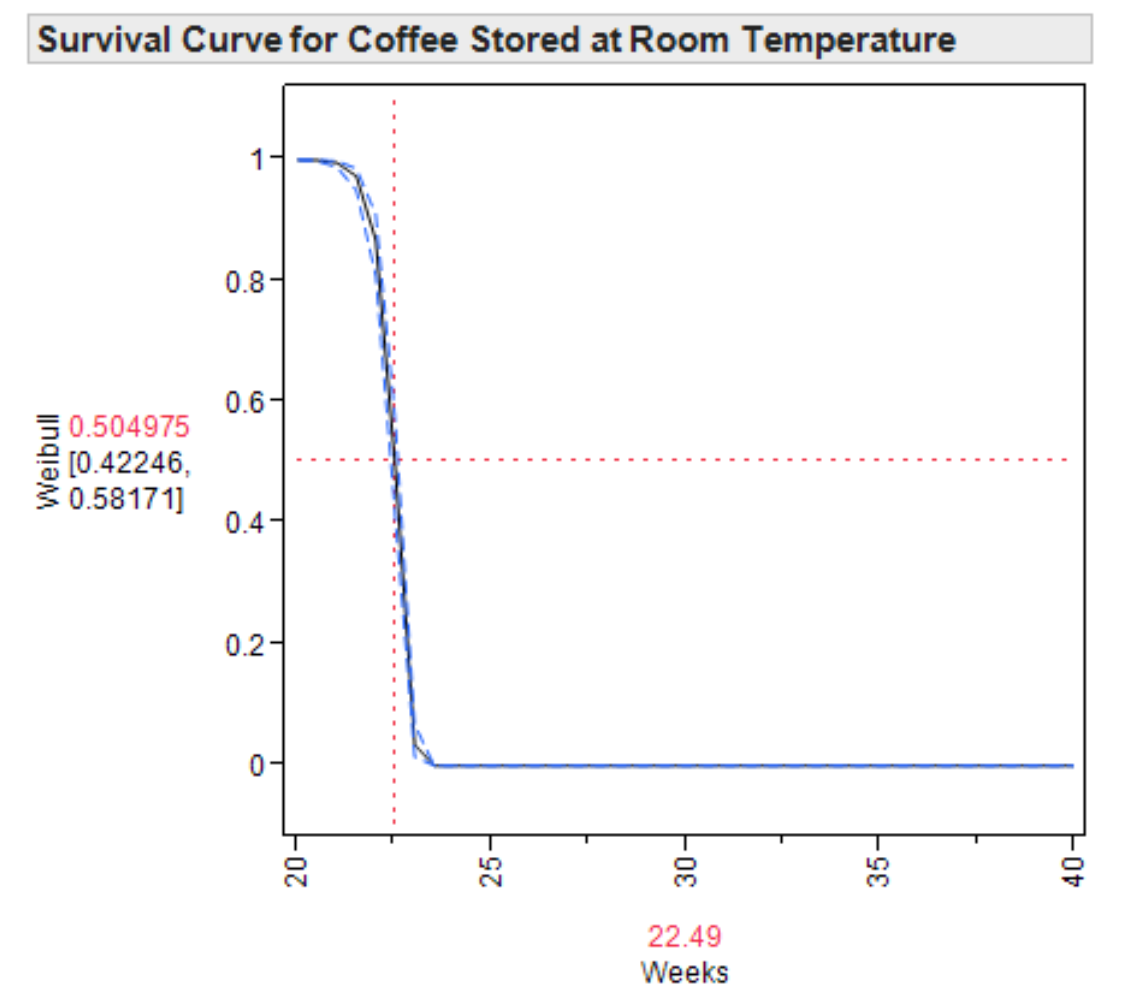 Figure 4. Survival curve for ground coffee stored at room temperature
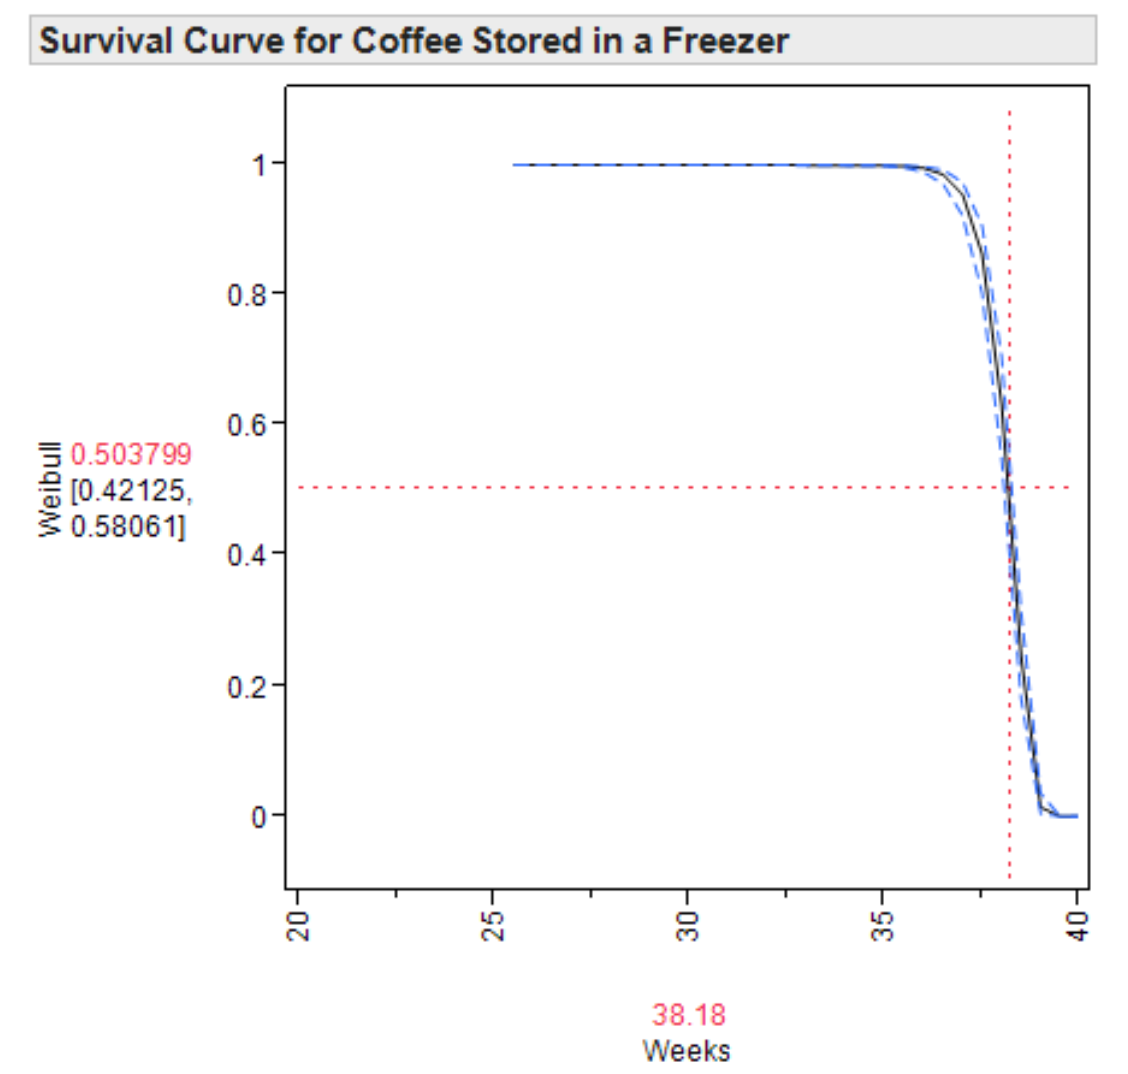 Figure 5. Survival curve for ground coffee stored in a freezer
Notice, in Figure 4, that the shelf- life (time until half of the cans of coffee are not acceptable, shown by the red cross-hairs) at room temperature is about 22.5 weeks. When stored in the freezer (Figure 5), the shelf-life extends to about 38 weeks–about 70% longer.
If you intend to keep your coffee longer than 5 months, you definitely want to store it in the freezer.
Example 2: RFMD – Capacitor Reliability
Engineers at RFMD developed a method for measuring how many of the capacitors they produced were good, known as the “yield.” They tested each capacitor by applying a proprietary voltage pulse to it. The test was convenient, but was it affecting the future reliability of the capacitors?
To answer this question, engineers measured the reliability of two samples of capacitors, one that had been exposed to the test pulse and one that had not. You can see the results in Figures 6 and 7. (Notice that the horizontal scale is different in Figures 6 and 7.)
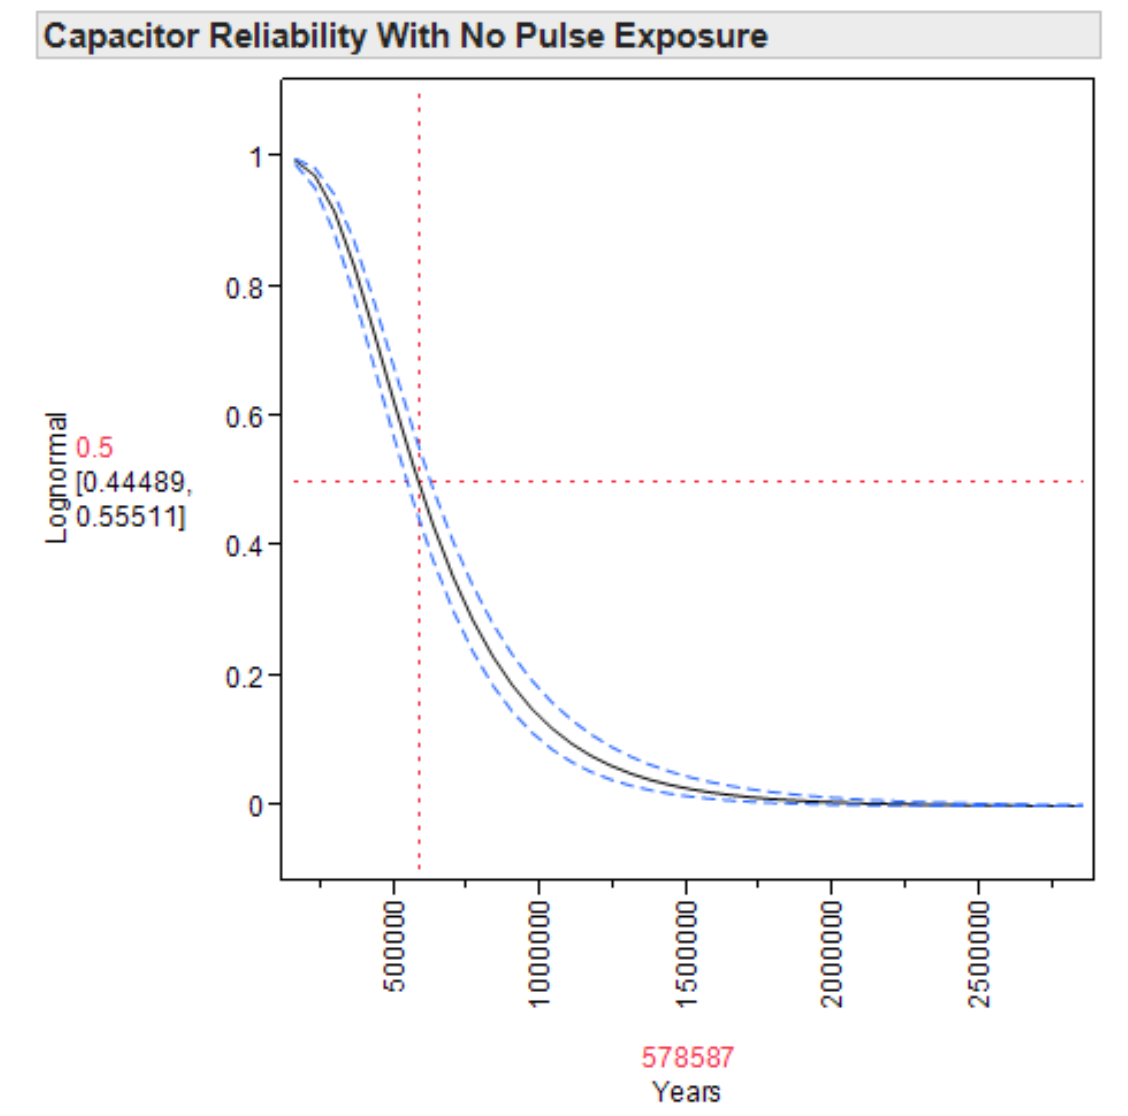 Figure 6. Survival curve for capacitors not exposed to a test pulse
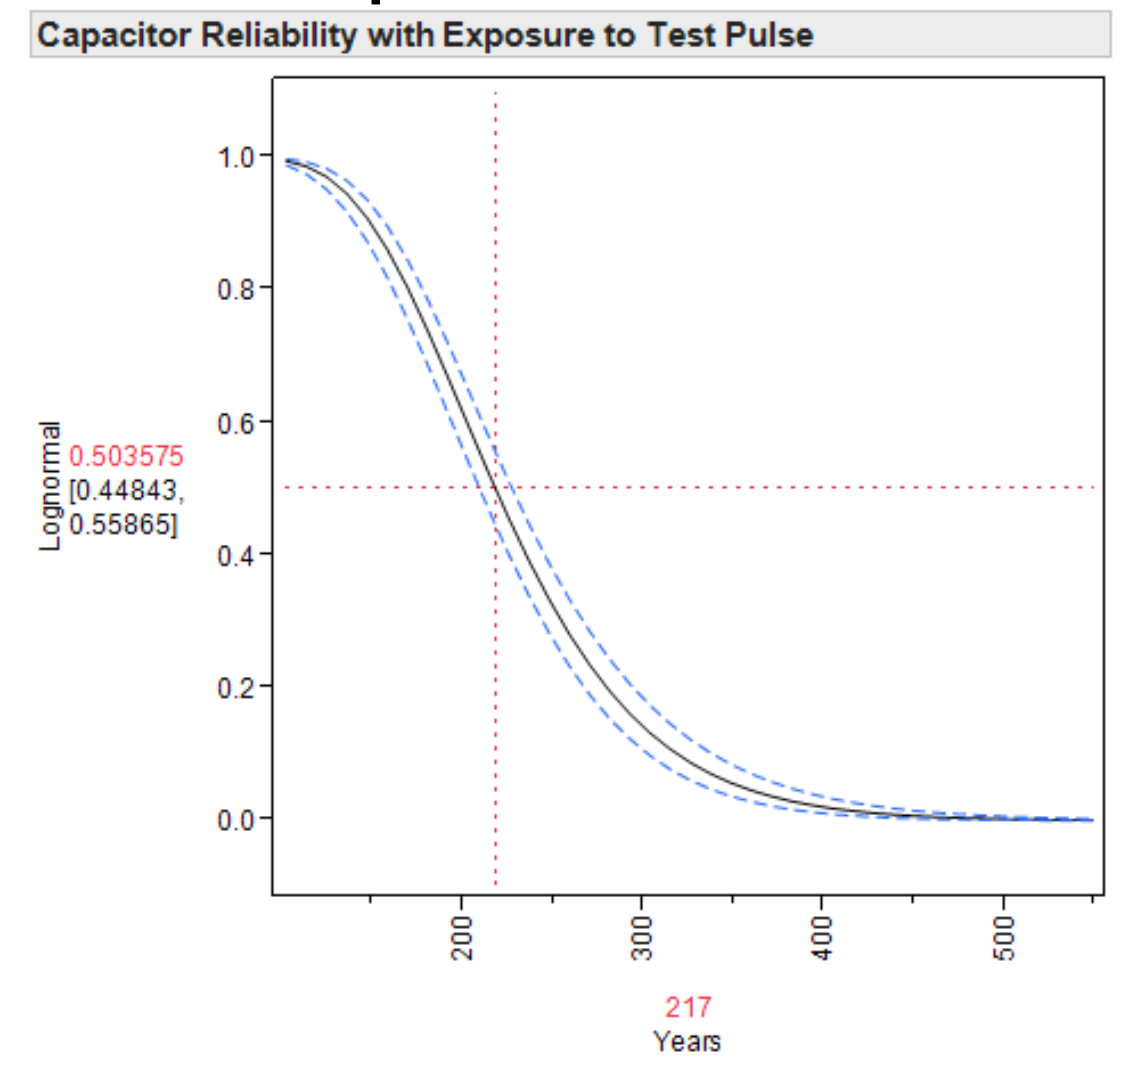 Figure 7. Survival curve for capacitors exposed to a test pulse
Notice, in Figure 6, that the predicted Life for untested capacitors is very long–578,587 years! In Figure 7, the predicted life of tested capacitors is only 217 years, a very substantial drop. Also notice that the first failures for the capacitors with no test pulse will not occur in a normal human lifetime, while a very few capacitors exposed to the pulse might fail in less than 50 years.
These capacitors are intended for use in cell phones lasting only a few years, so the decreased reliability may not be a concern–that is a decision for management. However, the ability to measure the change is very valuable.
Example 3: Hewlett Packard – Circuit Board Reliability
Hewlett Packard looked at the Reliability of different types of circuit boards. They soldered components to the boards and then flexed the boards until they saw a solder joint break.
Figures 8 and 9 show the results for two types of boards – copper plated with nickel and then gold (Cu-Ni-Au), and copper plated with nickel and then tin (Cu-Ni-Sn). Clearly the gold plated boards in Figure 8 are significantly more reliable—they can take more abuse. Failures begin occurring much later. It takes 3 times as long for half of the boards to fail. It's a good thing gold plated boards are used in medical equipment!
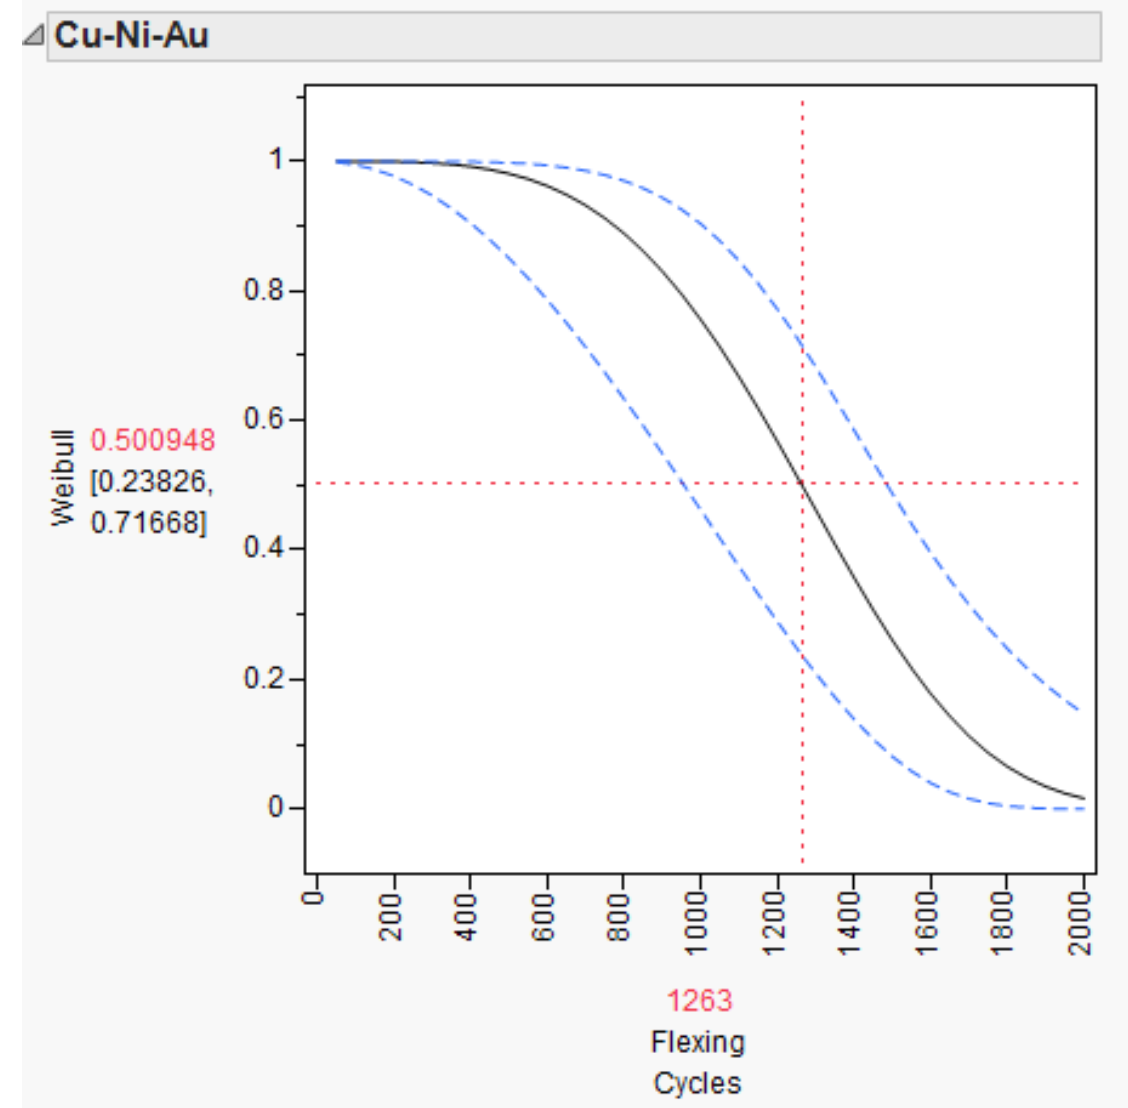 Figure 8. Survival curve for copper/nickel/gold circuit boards
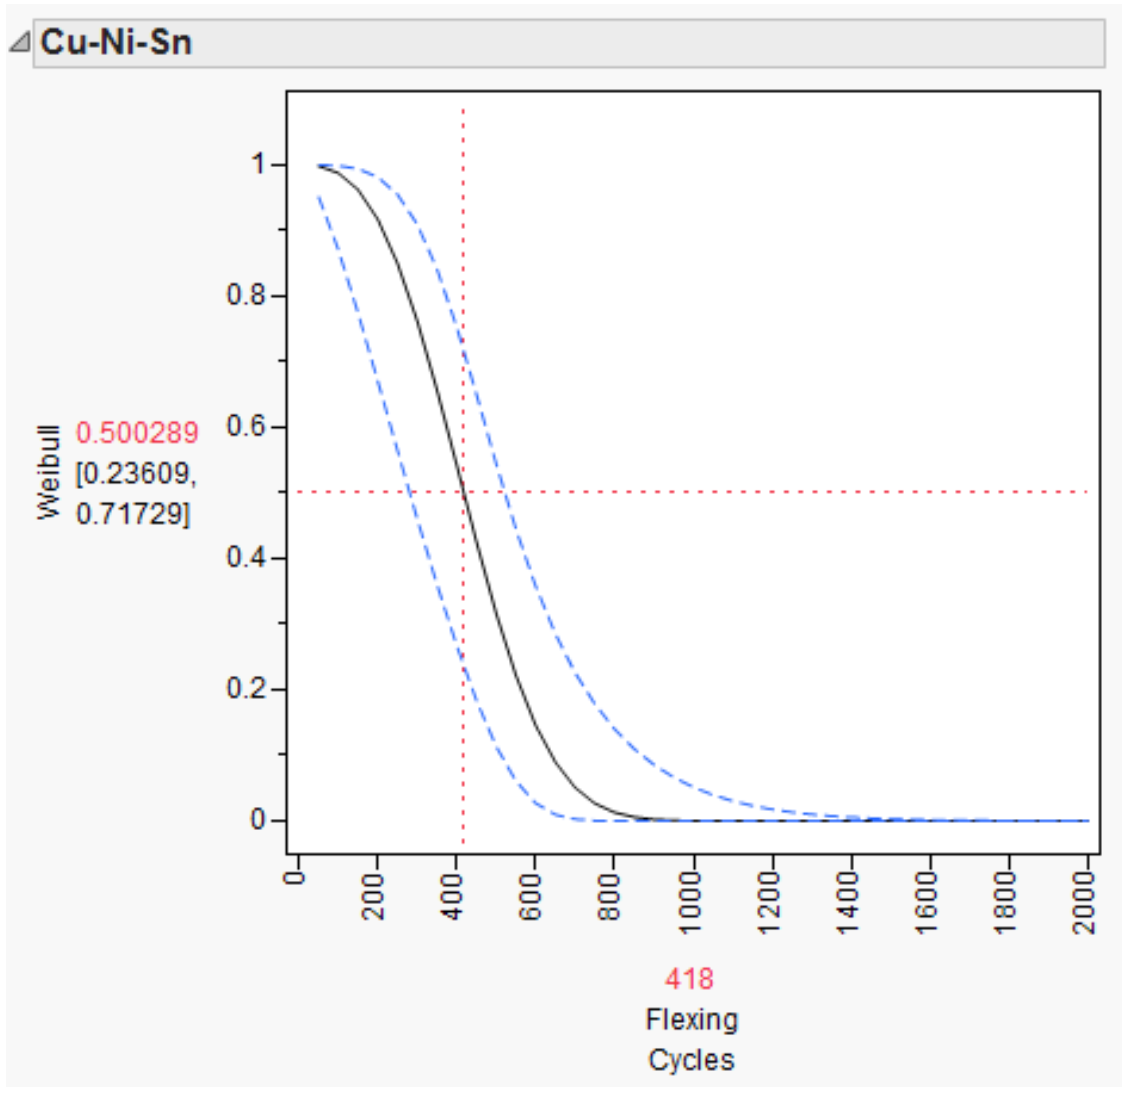 Figure 9. Survival curve for copper/nickel/tin circuit boards
Learning Reliability Analysis Can Be Easy
Reliability Analysis relies heavily on complex math. Because of this, Reliability Analysis has been a specialized field for engineers who enjoy math. This extremely valuable tool has been hidden from most engineers by math and jargon.
Objective Experiments's specialty is making complex subjects practical. Thanks to the workshop “Objective Reliability Analysis” and major advances in Statistical software packages, you can learn Reliability Analysis with no math and a bare minimum of new terminology. In fact, learning Reliability Analysis can be fun and easy!
Conclusion
In this post you have seen that Reliability Analysis helps you measure accurately how long you can expect your products to perform without failing. Reliability Analysis is no longer difficult to learn and use. Now that you can measure Reliability and Product Life, you can improve them.
Looking for More?
Here are some interesting references for further information:
-
Meeker and Escobar, Statistical Methods for Reliability Data, J. Wiley, ISBN 0471143286
-
Trindade and Tobias, Applied Reliability, Third Edition, CRC Press, ISBN 1584884665
-
Silverman, Mike, How Reliable is Your Product?: 50 Ways to Improve Product Reliability, Super Star Press, ISBN 160773060X
-
O'Connor, Patrick, Practical Reliability Engineering, Wiley, ISBN 047097981X
-
Summerville, Nicholas, Basic Reliability: An introduction to Reliability Engineering, Author House, ISBN 1418424188
Questions?
If you have questions about this post or are looking for more information, please contact us.